|
The following example notes and white papers illustrate MAISY database and model applications.
-
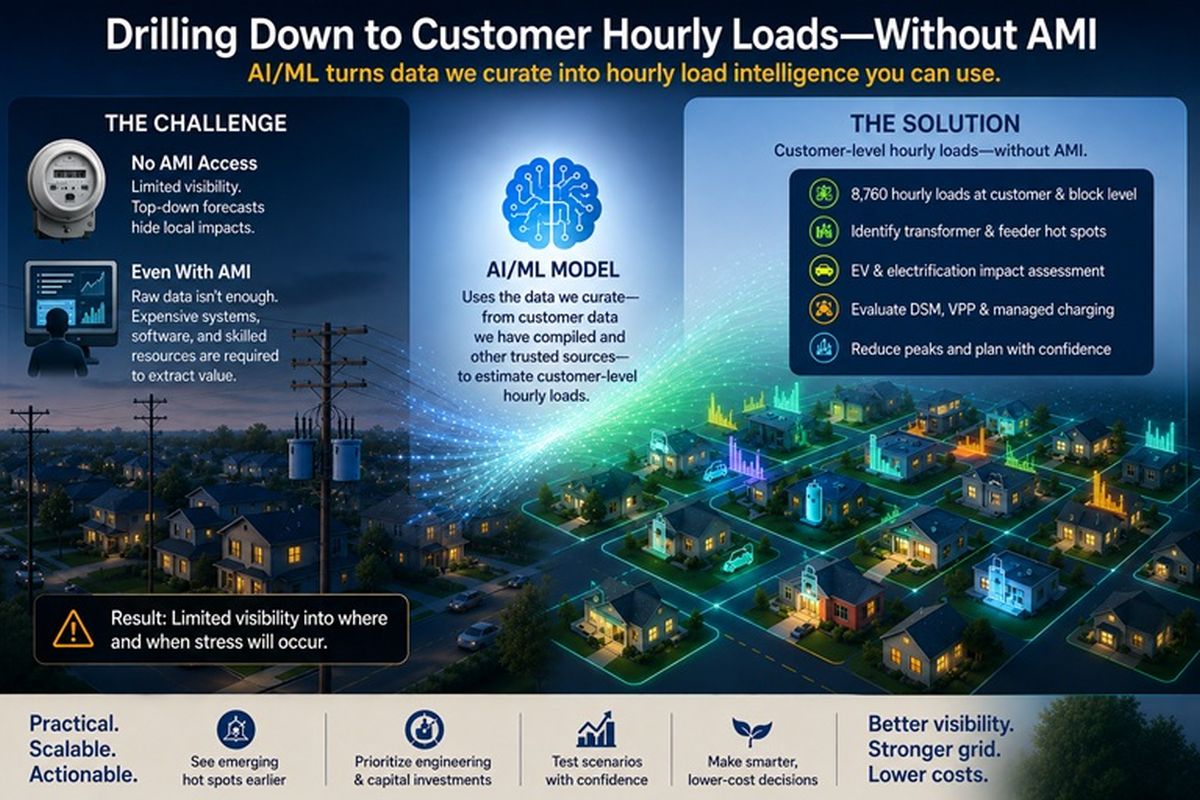
Drilling Down to Customer Hourly Loads -- Without AMI, May 10,2026
See the full paper
Utilities need customer-level hourly load visibility to manage EV growth, electrification, and rising peak demand. But most don’t have usable AMI data for this purpose - and even those that do often lack the tools and resources to turn it into actionable planning insight.
The reality: Raw interval data ≠ forward-looking load intelligence.
Extracting value from AMI typically requires significant investment in data systems, analytics platforms, and specialized staff. Many utilities aren’t there yet—and some won’t be anytime soon.
There’s another path: using AI and machine learning.
It’s now possible to estimate customer-level hourly loads without direct AMI access. By combining anonymized utility customer characteristics with large-scale, pre-developed datasets (millions of customer records and end-use load shapes), models can create “digital twins” that simulate how customers actually use energy—hour by hour.
The result:
-
8,760 hourly loads at the customer and block level
-
Visibility into where EV and electrification loads will cluster
-
Early identification of transformer and feeder “hot spots”
-
Ability to test managed charging, DSM, and VPP strategies
-
Insight into coincident system peak impacts
This approach doesn’t replace AMI or engineering tools—it fills the gap upstream.
It gives utilities a practical way to see where and when stress emerges before it shows up in the field, and to evaluate mitigation options in a coordinated, cost-aware way.
As electrification accelerates, waiting for perfect data - or perfect systems -isn’t a strategy ---- Better visibility is.
See the description of the
Grid Impact Model (GIM)
for additional information on the SGRC Grid Impact Model and the digital twins modeling methodology
-
Built on a $1B Data Asset: AI-Powered Neighborhood Load Forecasts for Utilities, July 15,2025
AI can process large disparate databases to provide answers to questions that were previously nearly impossible to address. In addition, applying AI to existing information sources provides new insights at a small fraction of the cost that would be incurred if the data development and analysis started from scratch.
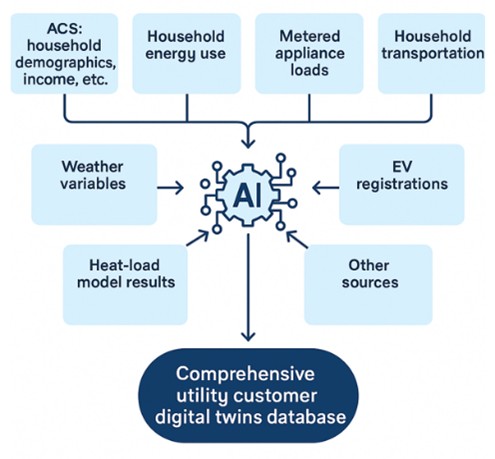
A perfect example is the development of a ZIP-detailed digital twins (DT) forecasting and analysis model to assess utility grid-impacts of future EV charging, smart-grid management and control, weather extremes, and other issues. DT analysis models the behavior, and in this application, the hourly electricity use of actual individual utility customers to determine neighborhood grid demands. Accurate utility customer information is critical.
The Smart Grid Research Consortium (SGRC) AI DT model uses the American Community Survey (ACS) 5-year micro-data sample of 8 million actual utility customers to avoid the huge cost of independently developing household income, demographics, dwelling unit, and other information for utility customers within each utility service area.
According to a January 2024 Congressional Research Service report, the FY2023 ACS budget totaled about $250.9 million for a single year, implying total development cost for the 5-year sample of more than $1 billion.
Using AI to integrate ACS as a foundational data source with other databases (see graphic) provides the first comprehensive database of actual individual utility customers required to provide digital twin models for any US electric utility company --- models built on top of a billion dollars of free data.
See the description of the
Grid Impact Model (GIM)
for additional information on the SGRC Grid Impact Model and the digital twins modeling methodology
-
Next-Gen Models: Forecasting EV Loads with Digital Twins, April 28, 2025
A critical new imperative for many utilities is forecasting the upsurge in
small-area grid loads caused by rapidly growing EV ownership. Unanticipated
grid overloading can cause low voltage, flickering lights, reduced transformer
lifetimes and even blown transformers, not to mention customer
complaints/ dissatisfaction.
Forecasting these neighborhood-level loads requires an entirely new
set of tools well beyond traditional utility system-wide energy and peak
modeling methodologies. Digital twin modeling, a new forecasting technology
that is increasingly being used to model and analyze electric utility
distribution equipment, is a perfect application to forecast these small
areas EV grid threats.
EV digital twin modeling applies information on actual utility
customers identifying new EV ownership and grid load impacts and results
of load-shifting utility programs. Models are updated periodically to r
efine customer ownership, loads and utility program model relationships
based on actual household information.
-
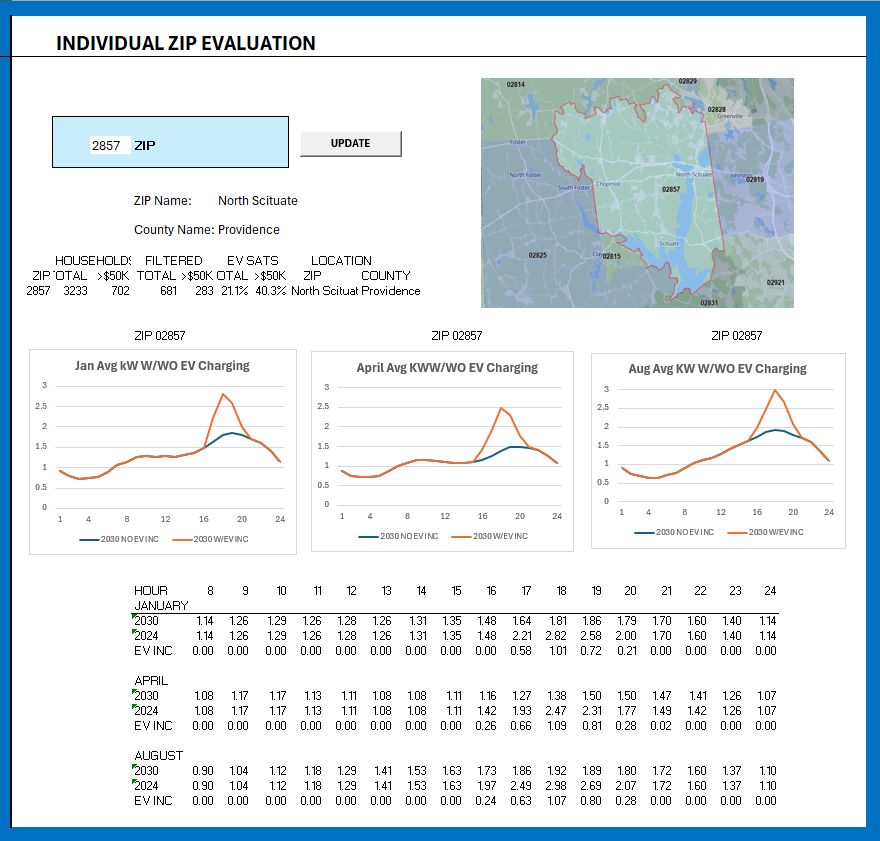
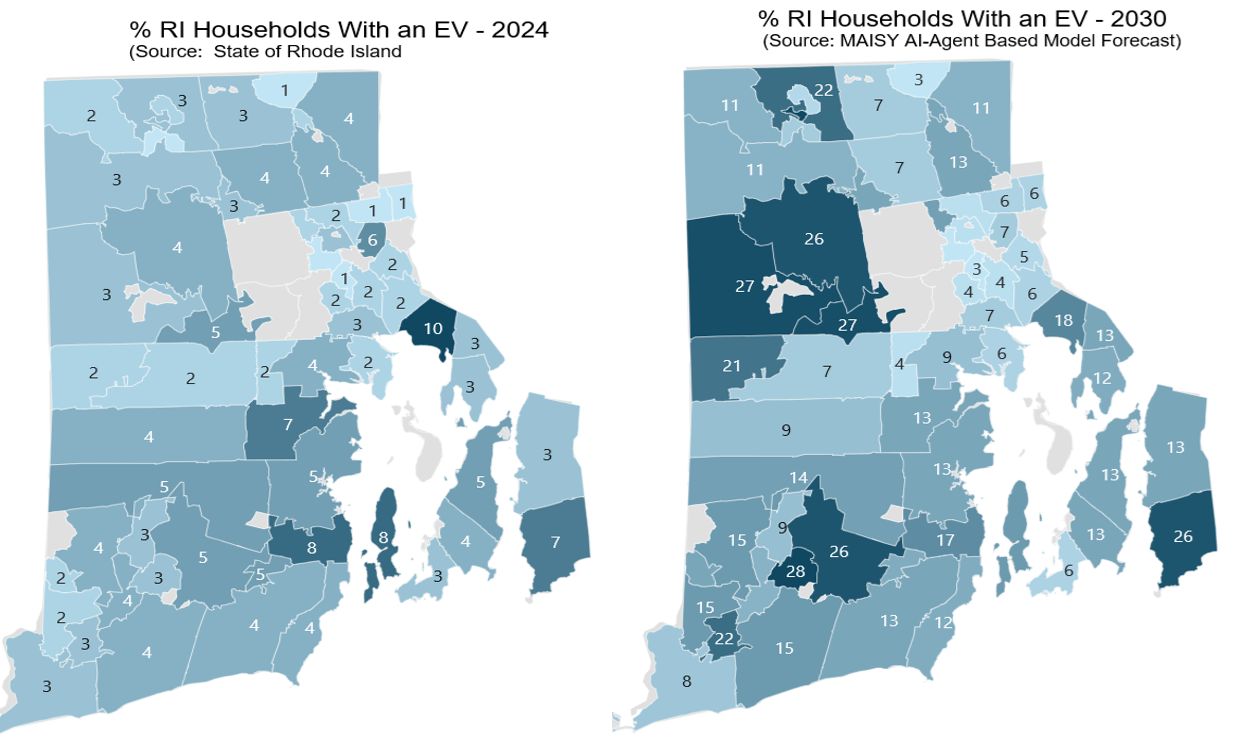
New AI Model Now Forecasts Future EV Hourly Load Impacts for any ZIP Area or Neighborhood in the US, January 23, 2025
Most electric utilities are struggling to understand how the rapidly growing number
of EVs (electric vehicles) will impact their distribution systems. Adding just a few level 2
EV chargers in some neighborhoods can cause low voltage, flickering lights, reduced transformer
lifetimes and blown transformers. Our recent paper
presented an AI agent-based EV ownership model and 2030 EV ownership forecasts for individual Rhode Island ZIP codes.
The AI agent-based model has been extended to forecast hourly EV charging kW loads.
The model provides whole-building 8760 hourly loads and EV charging loads for any
ZIP-defined geographic area in the US including utility service and metro areas, states
as well as neighborhoods and census tracts. A two-page description of the AI EV charging
load profile model and example 2030 analysis results are available at here .
-
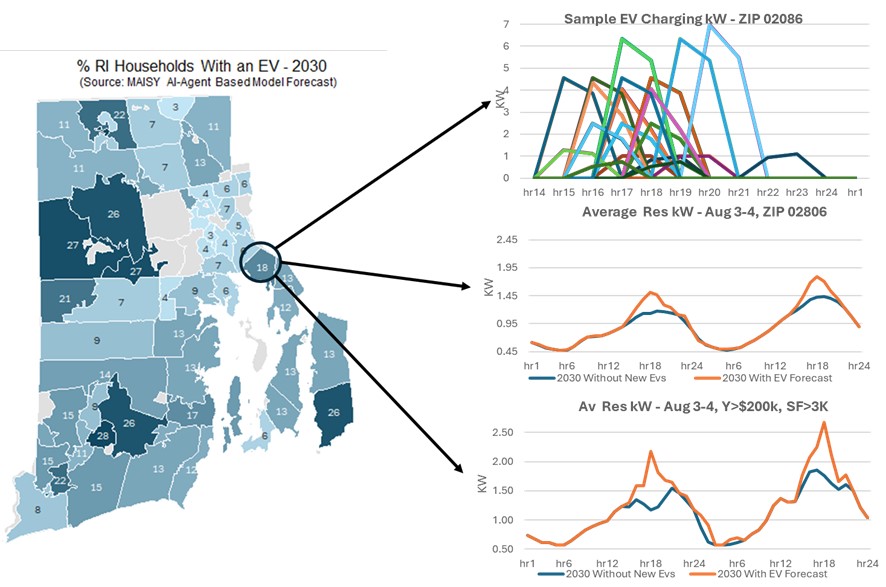
Agent-Based Model Uses AI to Map Future Utility EV Distribution Challenges; Identifies ZIPs with Greatest Future EV Increases
Most electric utilities are struggling to understand how the rapidly growing number of EVs (electric vehicles) will impact their distribution systems. Adding just a few level 2 EV chargers in some neighborhoods can cause low voltage, flickering lights, reduced transformer lifetimes and blown transformers.
Estimates from the National Renewable Energy Laboratory suggest that the 2023 EV household saturation (EVs as a percent of households) will increase from 2.6 percent to 18.3 percent by 2030 – a sevenfold increase.
The huge cost of required distribution upgrades requires utilities to prioritize areas that are most likely to see the greatest increases in EVs. Unfortunately, many utilities, even those with AMI systems, have no customer visibility beyond the substation and do not currently have a reliable way to estimate EV growth for different distribution areas.
A new AI agent-based model provides EV growth forecasts at the ZIP and census tract level to support utility evaluation/planning/upgrading. The MAISY AI agent-based model can be applied to any ZIP defined area (utility service area, state) for any year.
A four-page paper describes this new resource
-
New Study Finds Electric Grid Stress Will limit Residential Electrification/Emissions Initiatives, May 14 2024
A recently completed Jackson Associates study based on analysis of 18,400 US households concludes that while residential electrification would reduce emissions modestly, the additional burden on already strained electric grid capacity will significantly postpone or alter many of these initiatives.
Electrification is the umbrella term for transitioning to electricity in all possible applications to reduce greenhouse gas emissions. Dozens of cities and states have embarked on policies to limit fossil fuel use in new residential buildings and or appliances.
Utilities are already facing unprecedented electricity demand growth in large part because of the huge increase in the number of new data centers. According to Wells Fargo, electricity demand could conceivably increase by as much as 20 percent by 2030. This unexpected electricity demand surge is causing utilities and grid operators angst across more than a dozen states resulting in delayed decommissioning of coal generation and the addition of gas-fired peaking units to provide power during peak periods (e.g., 5-9 pm in the summer).
A critical question for the future of residential electrification initiatives is how much these programs would add to electricity demand and what are the emissions savings.
The study shows that significant increases in residential peak kW resulting from an electrification scenario over the next decade provide only modest gains for most state residential emissions as indicated by the chart below.
Average GHG savings were 2.5%, average peak period demand increase was 8.5% and annual energy consumption increase was 9.1%. Details for individual states and additional commentary are available at
The relatively large residential increases in peak electricity use in peak afternoon and evening periods and small savings in greenhouse gases suggest that additional burdens associated with electrification will be a hard sell to consumers as the current trajectory of electricity demand is already significantly increasing residential electricity prices.
Residential electrification will likely need to wait until the electric grid digests the huge meal provided by new data centers and manufacturing growth before proceeding on its mission to reduce greenhouse gases.
The paper provides detailed analysis of individual states along with commentary analysis on ten representative states.
-
New York Attorney General’s Emissions Lawsuit Highlights Scope 3 Reporting Risks, April 11 2024
The recent lawsuit by the NY attorney general against JBS foods (the largest beef processor in the US) challenging their emissions reporting highlights the reputational and financial risks associated with questionable emissions reporting.
This paper provides an update to a previous paper (Mortgagor & CRE Emissions Calculations: A 3-Page Summary, June 2023, https://maisy.com/scope3_financed_calc_summary.htm ) that identifies Scope 3 financed emissions reporting risks associated with changes in geographic distributions of mortgagors across different EPA emissions zones over time. An index-based emissions intensity (CO2e/mortgagor) calculation, similar to indexing methodology used by the US Department of Commerce, removes the bias that would occur if changes in mortgagor geographic distributions were ignored.
Analysis of
18,400+ individual household emissions across the US
reported here shows that changes in 7 other mortgagor characteristics over time can generate even more significant biases in reported emissions statistics unless addressed with index-based emissions calculations.
-
Offsetting The Coming Electricity Demand Surge with Smart Grid Technologies, April 4 2024
A recent Washington Post article highlights challenges facing electric utilities in meeting unexpected increases in electricity demand. For example, Georgia Power’s 10-year industrial forecast is now 17 times larger than it was a short time ago and Arizona Public Service projects a shortfall in transmission capacity within six years. Virginia and Texas are experiencing the same critical demand issues while coal plant closures are being delayed in KS, NE, WI and SC. Unexpected increases in data center electricity use for AI, cloud computing and crypto mining along with an upturn in manufacturing growth are identified as the causes of these critical future shortfalls in generation, transmission, and distribution capacities.
This study applies
US Department of Energy RECS databases extended to include end-use hourly
loads
to demonstrates how residential smart grid technologies can offset a significant
part of this near-term challenge.
Analysis of Arizona residential hourly loads suggests that peak demand
can be reduced by as much as 10 percent in that state providing critical time to plan and implement necessary grid expansions.
-
Apply Extended RECS Hourly Loads Databases to Develop Excel Agent-Based Energy
and Hourly Load Forecasting Models, February 21 2024
Energy and hourly load forecasting typically requires statistical knowledge applied in econometric models or in-depth appliance engineering data and market information used in end-use models. Agent based models apply an intuitive framework that models individual households, i.e., agent, behavior. This approach requires neither a statistical background nor detailed appliance engineering knowledge to produce model forecasts that, in many ways, are preferable to traditional econometric and end-use models.
This paper describes the development and application of an easy-to-use agent-based Excel model that applies an extended version of The Department of Energy’s 2020 Residential Energy Consumption Database (RECS, final release, June 2023). The RECS Database has been extended by Jackson Associates to include whole-building and end-use 8,760 hourly kW loads for each of the 18,400+ households in its national survey.
Agent based models have been used in a variety of industry applications for decades to provide valuable insights not available with econometric and end use models. RECS Extended Hourly Loads Databases provide a relatively simple agent-based easy-to-use Excel framework to forecast future energy demands and hourly loads. Model forecasts reflect impacts of electric price, income and equipment efficiency increases along with various demand management initiatives and other factors on individual households.
This paper presents average state-level variations in whole building hourly kW load profiles along with an example that highlights the benefits of examining individual household load profiles in more detail. A comparative analysis of a single state’s average water heating hourly load profile and hourly loads for individual households illustrates the advantages of focusing on individual household characteristics to target the most appropriate households for smart gird, demand response and load control program development and analysis.
-
New RECS Whole Building and End-Use Hourly Loads Data Provide Insights on 18,400+ US Households to Support
Smart Gird, Demand Response and Load Control Analysis and Programs, February 6 2024
The Department of Energy’s 2020 Residential Energy Consumption Database (RECS, final release, June 2023) has recently been extended to include whole-building and seven end-use 8,760 hourly kW loads and emissions data for each of the 18,400+ households in the national survey.
This brief two-page note presents average state-level variations in whole building hourly kW load profiles along with an example that highlights the benefits of examining individual household load profiles in more detail. A comparative analysis of a single state’s average water heating hourly load profile and hourly loads for individual households illustrates the advantages of focusing on individual household characteristics to target the most appropriate households for smart gird, demand response and load control program development and analysis.
-
Avoid ESG Reputational Risk with Indexed Emissions Intensity Measures:
A 2-Page Primer, July 18 2023
I recently downloaded a bank’s ESG report that revealed an unexpected annual increase in Scope 3 financed emissions intensity. The report narrative suggested that a change in one of the data inputs could be to blame. In fact, the increase was a result of a faulty emission intensity calculation, a result likely to befall other organizations that ignore complexities in calculating accurate emissions intensities.
Emissions intensities (e.g., emission/mortgagor) are the most critical component of reported emissions. Annual comparisons provide stakeholders with a measure of an organization’s success in achieving emissions reductions targets. Inaccurate emissions intensity calculations can sabotage a firm’s public image by reflecting increased emissions intensity when the opposite is true. Or, in a worst-case scenario, result in an external audit showing that reported emissions intensity data are overestimating emissions improvements.
Reporting annual emissions intensity data based on simple aggregated emissions is guaranteed to provide misleading results as illustrated in this note. While this discussion is oriented to financial institutions, recommendations for calculating unbiased emissions intensities apply to all ESG emissions intensity calculations.
-
Mortgagor & CRE Emissions Calculations: A 3-Page Summary, June 21 2023
Financial institutions are facing increasing pressure to report Scope 3 financed emissions – that is, emissions of their mortgage and commercial real estate (CRE) customers. A soon-to-be issued SEC rule will likely require mid-to-large financial institutions to report these data.
Since these emissions can account for 90 – 95 percent of all financial institution emissions, a reliable calculation of current emissions is important. More critical are the year-to-year emissions intensity estimates (e.g., emissions/mortgagor) presented for investors to evaluate emissions improvements over time. Inaccurate emissions calculations and emissions intensity statistics can sabotage a financial institution’s public image by reflecting increased emissions intensities when the opposite is true. Or, in a worst-case scenario, result in an external audit showing that reported emissions intensities are overestimating emissions improvements.
This paper spares readers working through the 400+ pages of the SEC’s proposed rule documentation and 150+ page PCAF recommendations. The PCAF (Partnership for Carbon Accounting Financials) is an international organization of financial institutions that provides a guide to Scope 3 calculation methodologies sanctioned by the SEC. The methodologies presented here are the most accurate and up-to-date recommendations available consistent with PCAF and likely SEC guidelines.
-
Scope 3 Financed Emissions Reporting: Beware - How Good Intentions Can Lead to Bad Outcomes
April 18, 2023
A proposed SEC rule will soon (May?) likely require mid-to-large publicly traded financial institutions to
calculate and report emissions of their residential mortgagors and commercial real estate (CRE) loan customers
(so-called downstream or Scope 3 emissions).
This proposed rule creates a huge new reporting requirement, reputational risk, reporting pitfalls and a challenging data
development effort for financial firms.
While many financial institutions have already made a commitment to reporting Scope 3 emissions the new rule will prompt
more to embark on this process, even if the final rule is delayed by legal challenges The road to emissions reporting is
filled with hazards.
Results of this study using actual mortgagor data show that initial emission estimates with aggregate data can
set financial firms up for disappointing year-to-year emissions reductions reports that show increasing
emissions per mortgagor when mortgagor emission are actually declining.
Study results show that:
• accurately estimating emissions and year-to-year emissions changes requires at the least ZIP-level detailed data and
• unbiased annual emissions intensities require the application of economic price index methodologies to reflect changes in mortgagor population characteristics.
-
Will Increasing Utility Generation Renewables Make Natural Gas Bans Attractive in More States in the Future? Ten
Year Forecasts Identify 5 States as a Yes and 31 States as a No, March 28, 2023
Two weeks ago, we presented results of a study (see the publication below) that showed that bans on natural gas/propane (NG/P) water
heaters would increase both CO2e levels and consumer costs in 36 states. We decided to extend our analysis to reflect CO2e
impacts ten years in the future assuming the percent of solar and wind resources in each state increases at an annual rate observed
from 2019-2022 based on EIA-923 Report on Electric Utility Generation data. This study identifies the number of years, at the current
rate of utility renewables investment, that would be required to make a NG/P bans an attractive option for reducing CO2e levels.
See Data for all 48 continential states here
-
Be Careful What You Wish For: Natural Gas/Propane Water Heater Bans Would Increase Both Carbon Emissions and Energy Costs in 36 States, March 16, 2023
Laws passed in California, New York, and several other states to ban natural gas and propane water heating are
often presented as models for the rest of the nation. However, an independent study finds that this
policy would increase carbon emissions in 36 states by an average of 6 % and increase household energy
cost by $176 per year. Annual cost increases in all 48 states average $200.
See emissions and cost impacts for all states here
-
New Study Shows 2020 - 2022 State Homeowner Energy Cost Inflation Ranges from 24% to 62%, Februrary 16, 2023
New Hampshire is the bigest energy inflation looser. ME, VT, CT, MA, RI, NY, NJ CA and IL round
out the top ten hardest hit states. See all state rankings here
-
Inflation Will More Than Double “Seriously Delinquent” Mortgages in 2023.
January 24, 2023
Estimated 2023 90+ day delinquencies caused by 40 year-high inflation are provided by
state and county.
-
Avoiding Scope 3 Financed Emissions Data Development Pitfalls, June 2022
-
Indiana Electricity Projections:
The 2021 Forecast Indiana State Utility Forecasting Group, December 2021
- SCE Electric Vehicle (EV) Virtual Power Plant Analysis Shows $5,600 10-Year Savings Per EV Customer, October, 2019
- Reducing Customer Acquisition Costs and Sales Cycles in the Commercial Battery Storage/PV Market with Marketing Analytics, January 2016
- Maximizing Competitive Advantage in Storage and PV Markets, White Paper, October 2015
- Utility Planning for Disruptive Solar PV Impacts, White Paper, July 2015
-
Future Energy: Improved, Sustainable and Clean Options for our Planet,
Elsevier Science; 2nd edition, 2014
-
Indiana State Utility Forecasting Group Electricity Projections (Purdue University):
December, 2013 Forecast Using MAISY Agent-Based Models
-
Promoting energy efficiency investments with risk management
decision tools,
Energy Policy, 2010
-
Improving Energy Efficiency and Smart Grid Program Analysis With Agent-Based End-Use forecasting Models,
Energy Policy, 2010
-
White Paper: Are Smart Grids a Smart Investment?
Hourly Load Analysis of 800,000 Utility Customers at 200 of the Largest
US Utilities, 2009
- White Paper: Shining the Light on Smart Grid Investments:A Duke Energy Case Study, 2009
- White Paper: Top 10 Energy Efficient States, 2008
- Energy Budgets at Risk (EBAR) (J Jackson, Wiley, 2008) Provides New Energy-Efficiency Investment Evaluation Tools
-
Ensuring Emergency Power for Critical Municipal Services With Natural gas-fired Combined Heat and
Power (CHP) Systems, Energy Policy, 2007
- Are US Standby rates inhibiting Diffusion of Customer-Owned Generating Systems? Energy Policy, 2007
For Additional Information Contact:
Jerry Jackson, President
Jackson Associates
37 N. Orange Avenue, Suite 500
Orlando, Fl 32801
407-926-4048
979-204-7821 (cell)
e-mail
|
|