Financial Institution Mortgagor & CRE Emissions Calculations: A 3-Page Summary
Mortgagor & CRE Emissions Calculations: A 3-Page Summary
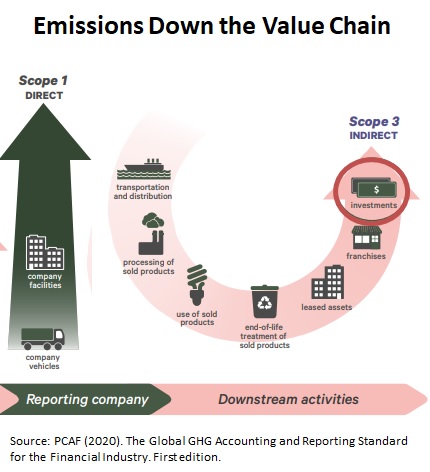
Click Here to Download the 3 Page PDF Whitepaper Summary. Financial institutions are facing increasing pressure to report Scope 3 financed emissions – that is, emissions of their mortgage and commercial real estate (CRE) customers. A 2023 California regulation requires financial insitutions operating in the state to report these data. Since these emissions can account for 90 – 95 percent of all financial institution emissions, a reliable calculation of current emissions is important. More critical are the year-to-year emissions intensity estimates (e.g., emissions/mortgagor) presented for investors to evaluate emissions improvements over time. Inaccurate emissions calculations and emissions intensity statistics can sabotage a financial institution’s public image by reflecting increased emissions intensities when the opposite is true. Or, in a worst-case scenario, result in an external audit showing that reported emissions intensities are overestimating emissions improvements. This paper spares readers working through the 150+ page PCAF recommendations. The PCAF (Partnership for Carbon Accounting Financials) is an international organization of financial institutions that provides a guide to Scope 3 calculation methodologies sanctioned by regulatory agencies. The methodologies presented here are the most accurate and up-to-date recommendations available consistent with PCAF guidelines. Emissions Calculations. PCAF recommended emissions calculations are straightforward. Financed emissions equals energy consumption for each loan customer’s building times an emission factor (available from the US Environmental Protection Agency) times the loan balance divided by loan origin property value. Actual individual mortgagor or CRE customer energy use is preferred; however, this information does not exist for most US loan customers. PCAF suggests using the most disaggregated energy use data currently available, which for US financial institutions is either segment-specific ZIP averages or individually estimated customer energy use based on financial institution loan customer data. Selection of customer data detail has significant implications on emissions intensity calculations as demonstrated in the next section. 
Emissions Intensity Calculation Challenges. The most critical reported emissions data is the annual emissions intensity statistic used to compare financed emissions from one year to the next (e.g., emission/mortgagor). The emissions intensity statistic uses financed emissions data calculated from the above equation. However aggregating loan customer emissions into an accurate representation of emissions intensity for year-to-year comparisons is a challenging statistical process. For example, a simple emissions/mortgagor intensity statistic can easily misrepresent changes in a financial institution’s loan customer emissions over time. Consider a hypothetical financial institution issuing mortgages in both California and Arizona with 1,000 mortgage customers in each state in 2021, with 100 new CA and 200 new AZ customers in 2022. Assume outstanding loan amounts are reduced by 5 Percent from 2021 to 2022 and new customers use an average of 10 percent less energy compared to the 2021 customer base in each state. Average AZ mortgagor CO2e emissions are 2.6 times that of similar CA customers because AZ generation uses more fossil fuels (e.g., coal) for electric generation and because households use more electricity. Calculating average 2022 emissions from the entire mortgage population and dividing by 2021 average emissions provides an emissions intensity estimate/mortgagor that is 10% greater because of the larger portion of AZ mortgage customers added in 2022. However, the emissions intensity statistic should decline from 2021 to 2022 because outstanding loan amounts of 2021 mortgagors declined by 5 percent and the average emissions of new customers within each individual state has been reduced by 10 percent because of more efficient new loan customers. The solution to correcting this misrepresentation is to calculate an emission intensity reflecting changes in the relative importance of CA and AZ market segments. A weighting process like that applied in US Commerce Department price indexes should be applied to ensure accurate emissions intensity calculations. Price Index Methodologies. Price indices apply calculation methodologies designed to provide objective price comparisons over time. For example, one can calculate the increase in household food prices by calculating the cost of a current market basket of food items purchased today and dividing by the cost of that same market basket using last year’s prices. An algebraic representation of this calculation for the CA-AZ emissions intensity example is: 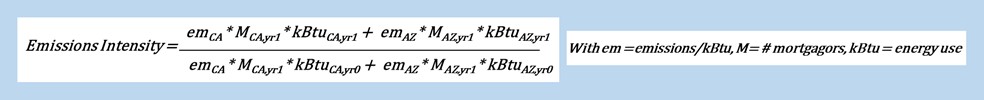
Emissions Intensity Index-Based Example. 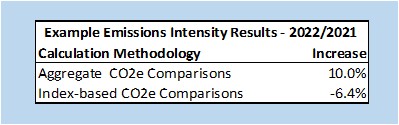 Calculating the CO2e emissions intensity using a price index methodology shows the more accurate 2021-2022 reduction
in emissions intensity shown in the table on the right. The corrected index-based emissions intensity declined by 6.4 percent compared to the gross estimated increase of 10 percent calculated above.
Calculating the CO2e emissions intensity using a price index methodology shows the more accurate 2021-2022 reduction
in emissions intensity shown in the table on the right. The corrected index-based emissions intensity declined by 6.4 percent compared to the gross estimated increase of 10 percent calculated above.
A shift in intrinsic characteristics (i.e., immutable characteristics like living in CA or AZ) of the mortgagor population shouldn’t impact the intensity measure; otherwise, financial institutions would be incentivized to unfairly discriminate among mortgagor segments based on intrinsic factors that are not under control of their customers. Additional customer segment specifications should be identified including the relative importance of all-electric buildings, new construction versus existing buildings, solar installations, dwelling unit size, CRE business type and other factors to provide unbiased index-based year-to-year emissions intensity comparisons. The indexing methodology shown above is called a Paasche index which uses current year segment populations. Several other indexing methodologies can be used; the important take-away is that only an index-based methodology with appropriately defined customer segments will provide an objective emissions intensity appropriate for year-to-year Scope 3 Financed Emissions evaluations. What Level of Data Detail for Emissions and Emissions Intensity? PCAF recommends using the most disaggregated energy use data currently available with a recommendation to improve data quality over time. Interpretation: use whatever data is easily available and plan to improve. The problem with this approach, as the CA-AZ example above shows, is that the easiest aggregate emissions/mortgagor emissions intensity reporting can be wildly inaccurate. A reported emissions intensity showing a 10 percent annual increase with a more accurate revision that shows a 6.4 percent decrease will not instill much confidence in reporting accuracy. Financial institutions’ emissions reporting and intensity statistics should include appropriately segmented ZIP level data or individual AI-based customer data. ZIP-level energy use and emissions data are currently available to provide unbiased emissions and emissions intensities. Financial institution customer loan data can be used with AI-based customer energy use imputations to provide the most accurate emissions analysis. More detail on these two approaches is provided below:
About the Author. Jerry Jackson is a Ph.D economist who provides consulting services to clients concerning energy data and analysis and scope 3 residential and commercial firm emissions data. He is the author of the widely used 7+ million record MAISY Utility Customer Energy Use and Hourly Loads Databases. MAISY databases are available as Excel files or accessed online with an API to provide an unlimited number of individual customer energy use and emissions estimates. The API applies an AI K-nearest neighbor machine learning statistical estimation process to match individual customer inputs (e.g., ZIP code, household members, etc.) with the closest MAISY record to estimate each customer’s energy use and emissions. His clients include more than one hundred private companies, state and federal agencies. He can be reached at jjackson@maisy.com Click Here to Download the 3 Page PDF Whitepaper |
Other MAISY Financed Emissions Accounting Data and Services Topics |