Avoiding Scope 3 Financed Emissions Data Development Pitfalls
Scope 3 Financed Emissions Reporting: Beware - How Good Intentions Can Lead to Bad Outcomes
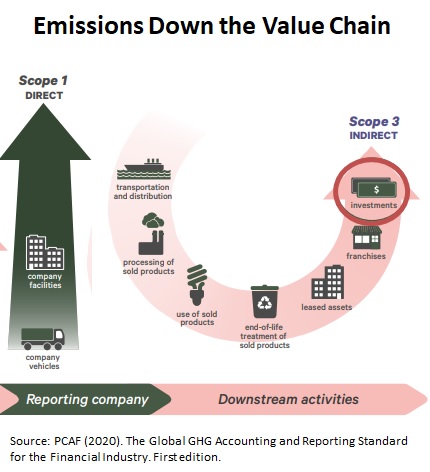
Click Here to Download the 5 Page PDF Whitepaper An new proposed SEC rule will likely require mid-to-large publicly traded financial institutions to calculate and report emissions of their residential mortgagors and commercial real estate (CRE) loan customers (so-called downstream or Scope 3 emissions). This proposed rule creates a huge new reporting requirement, reputational risk, and a challenging data development effort for financial firms. Legal challenges will undoubtedly delay implementation; however, a delay will not postpone pressure on many financial institutions to report Scope 3 emissions to satisfy stakeholder interests. Financial institutions are already feeling pressure to report Scope 3 emissions because of widely accepted reporting methodologies published in the Partnership for Carbon Accounting Financials’ Global GHG Accounting & Reporting Standard (the “PCAF Standard”). This methodology recommends calculating emissions by multiplying number of mortgagors times an emission factor. PCAF methodology states that “financial institutions shall use the highest quality data available for each asset class and improve the quality of the data over time.” Financial firms might reasonably assume that a good faith strategy would be to start with regional emissions factors and number of mortgagors and update these data over time with more granular geographic data. As demonstrated in this paper, this approach is hazardous as data refinements can provide year-to-year results that indicate an increase in emissions per mortgagor when emissions are actually declining. While intuitively appealing, PCAF methodology has serious down-side risks for reporting institutions who fail to use at least ZIP-detailed data. Equally important, annual emissions intensity calculations require the application of economic price index theory to account for year-to-year changes in non-energy-efficiency related mortgagor customer population characteristics. Emissions reporting raises the potential for reputational risk. This new SEC reporting requirement opens the door to independent auditing and challenging of the reported results, so financial firms need to make every effort to provide the most accurate emissions data available to avoid challenges to corporate CSR commitments. The following section summarizes the most important calculation-related elements of the proposed rule. Analysis of homeowner emissions within Orange County Florida (Orlando), demonstrates the importance of emissions calculations at the ZIP level for mortgagor segments. Final paper sections discuss emissions reporting reputational risk and describe an AI emissions calculation option for financial firms with access to detailed data for individual mortgagors. Background on the Proposed Emissions Reporting Rule The SEC’s objective in the proposed rule is to provide “information to investors to enable them to make informed judgments about the impact of climate-related risks on current and potential investments. Disclosures “would also enable an investor to assess the efficiency and efficacy of the registrant’s actions to achieve its target or goal.” The proposed rule will require firms to provide the breakdown of the different GHG (greenhouse gas) emissions along with a description of “the methodology, significant inputs, and significant assumptions used to calculate its GHG emissions metrics.” PCAF methodology, which is presented by the SEC as an acceptable analytic approach, states that “financial institutions shall use the highest quality data available for each asset class and improve the quality of the data over time.” Proposed rule provisions require a description of any change in methodology used to calculate emissions or emissions intensity to allow investors to judge how such changes might have affected year to year comparisons. The rule also requires data gaps to be identified and how “accounting for any data gaps has affected the accuracy or completeness of its GHG emissions disclosure. This information should help investors understand certain underlying uncertainties and limitations, and evaluate the corresponding reliability, of a registrant’s GHG emissions disclosure.” A particularly thorny issue for financial firms is the development of year-to-year emissions comparisons which, according to the SEC “would provide a standardized method for presenting such measure of efficiency across registrants, which should facilitate comparability of the registrant’s emissions efficiency over time.” In summary, the SEC proposed rule expects Scope 3 emissions filings that
Meeting these expectations in the most cost-effective manner requires a data development strategy that recognizes availability of existing data both inside the financial institution and from other sources and begins with a methodology that is as accurate as possible, requires minimum revisions over time and will be scalable as more information becomes available. Geographic Granularity 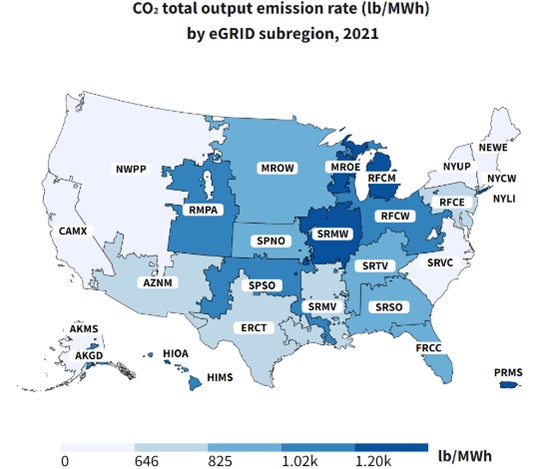 As indicated in the EPA emissions factor map, mortgagors with identical electricity use will generate different levels of emissions depending on their geographic location. Electric generation emissions in each subregion are a function of generation technology (e.g., hydro, nuclear, gas turbines) and generation fuels (e.g., natural gas, coal). The emissions map also shows that subregion boundaries do not coincide with state lines. Fortunately, EPA publishes ZIP codes - emission subregions mapping. Given the ZIP emission detail and the variation in subregion emissions, ZIP level calculations are an obvious choice to provide as much accuracy as possible in calculating financed scope 3 emissions.
While financial institutions possess mortgagor ZIP codes, no information is available from mortgagors on their energy use required to calculate emissions. Some public information is available for average homeowner energy use at the regional level and in some cases at the state level; however, this data is not helpful because of the diversity of homeowner energy use within a state or region. Variations in fuel used for space heating, water heating, cooking and clothes drying is substantial within states. This together with variations in climate, dwelling unit floor space, demographics, income and other items makes the use of regional, or state average homeowner energy use estimates inappropriate sources for “average dwelling unit energy use“ values required in PCAF calculations . Average energy use and resulting emissions estimates can vary significantly even across ZIP codes within the same small geographic area. For example, CO2e emissions data for 44 ZIP code areas in Orange County, Florida (population ~ 1.2 million) shown below reveals a range of 12,000 to 22,000 pounds of CO2 for the average homeowner in each ZIP code. The data source for this chart is the MAISY ZIP Level Scope 3 Emissions Database. 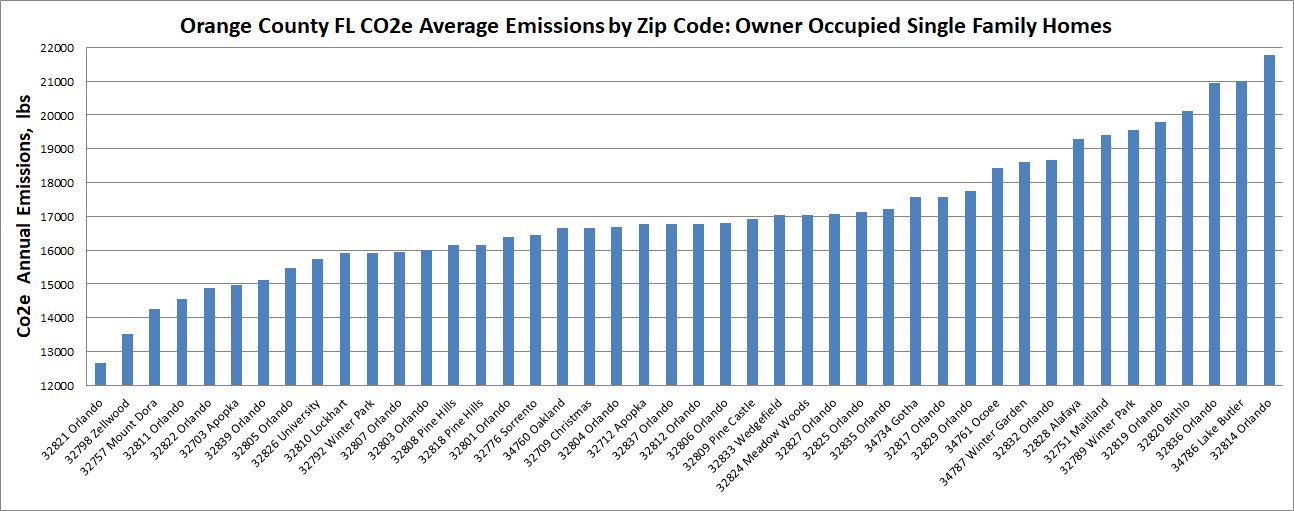
This ZIP code variation clearly shows that ZIP level-detail should be used for any emissions calculations based on average dwelling unit energy use. To summarize, availability of emissions factors by ZIP codes along with variation in average dwelling unit energy use across ZIP codes requires ZIP level energy use/emissions calculations. Customer Segmentation While ZIP-level average dwelling unit energy use and emissions factors resolve much of the aggregation bias that would be present with state-level data, financial institutions can take advantage of another mortgagor data item that they already possess: household income. Identifying customer emissions separately for general income segments within ZIP codes can improve estimates of average energy use and emissions and provide context to changes in emissions and emissions intensity over time. 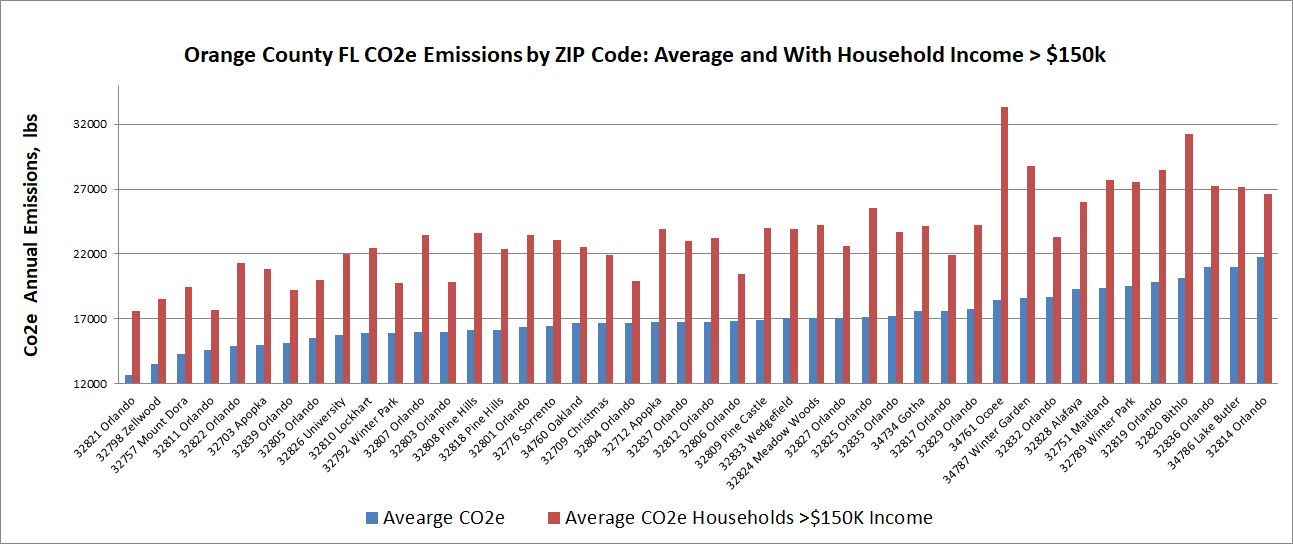
Variations in average mortgagor emissions across ZIP codes based on household income can be significant as illustrated in the chart below for Orange County Florida across ZIP codes and income categories. Additional data items that may be available to financial firms including household size and householder ages can also be used to develop more detailed energy use/emissions mortgagor segments. Reputational Risk Associated with Emissions Reporting Independent auditing and challenging of reported emissions results create a reputational risk that makes it imperative that financial institutions apply the most accurate emissions calculations methodologies available. Corporate CSR commitments are likely to be challenged if third-party evaluations differ significantly from emission report results. Financial institutions also need to be prepared to address third-party estimation deficiencies that inaccurately assess emissions report results. As suggested by the variation in ZIP level emissions data for Orange County, changes in the geographic composition of mortgagors within the county over time can result in a total increase in emissions only as a result of a greater number of new mortgages in ZIP codes with larger homes, more household members and with electricity end uses rather than natural gas. This can occur even if the new mortgagors occupy homes that are more energy efficient. Ignoring the change in customer distributions in this example generates an “apples to oranges” yearly comparison. The solution to providing emissions intensities that provide comparable statistics from year to year is to apply economic price index methodologies such as those used in the US consumer price index. When applied to emissions intensity calculations, these methodologies weight individual segment emissions in each year to account for differences in customer population distributions providing a mortgagor intensity estimate that filters out year to year changes in the number of mortgagors within each market and customer segment. That is, estimates that provide an apples-to-apples comparison. A detailed description of computing unbiased emissions intensity data and economic price index theory is beyond the scope of this white paper; however, this issue should be addressed by every organization that reports or is considering reporting Scope 3 emissions. Organizations who ignore the implication of population, dwelling unit and demographic segment shifts in their calculations may end up having to explain how their efforts to reduce carbon emissions seem to do the opposite. Using MAISY Artificial Intelligence App to Estimate Individual Mortgagor Emissions The discussion above illustrates the importance of applying granular geographic data at least down to the ZIP-level along with customer income and potentially other segmentation for emissions. This level of geographic/customer segmentation can be supported with easily-accessible mortgagor data available to most financial institutions. Another option is available to develop even more granular data for individual mortgagors. Financial institutions that have access to additional mortgagor information such as that included on Freddie Mac’s Form 65 including number of household members, income, age of householders, and other data can use an AI application that estimates energy use and emissions for individual mortgagors. Freddie Mac’s Form 65 data can be supplemented with local tax authority data at a reasonable cost to provide dwelling unit size (square feet) , existence of swimming pools, and other energy-related dwelling unit characteristics. These data are available from a variety of commercial providers who can match mortgagor addresses to tax records. The MAISY AI Energy/Emissions App uses an artificial intellegence KNN machine-learning process to estimate energy use and emissions for any individual mortgagor in the US. This application provides the most accurate mortgagor emissions estimates available. See *** for more information on MAISY AI KNN applications. Summary The objective of this white paper is to underscore the importance of developing a Scope 3 financed emissions data development strategy that
Availability of EPA emissions factors and number of mortgages by ZIP code make a ZIP-based methodology by far the best choice for financial institution emissions calculations. Applying ZIP level information for mortgagor income will improve accuracy and should be part of each financial firm’s data development strategy even if these data require more effort to extract from legacy database systems. Financial institutions with detailed individual mortgagor information like that included in Freddie Mac’s form 65 can take advantage of an artificial intelligence application that calculates energy use/emission for individual mortgagors providing even more detailed input to Scope 3 emissions results. Financial institutions face a difficult challenge and reputational risk in quantifying emissions intensity that will be used to judge success in annual improvements in Scope 3 emissions intensity. Changes in non-energy-efficiency related customer population characteristics will distort this statistic unless explicitly taken into account. This paper introduces the application of an emissions intensity index based on economic price index theory to account for these biases to provide a more accurate measure of financed emissions intensity. Jerry Jackson, President of Jackson Associates (JA), is the author of MAISY ZIP Level Scope 3 Emissions Databases, developed from MAISY ZIP Level Utility Customer Energy Use Databases. MAISY Databases were first introduced in 1995. Annual updates have expanded databases to include data from more than 7 million US utility customer records. MAISY data have been used by the US Department of Energy in analysis supporting appliance efficiency standards, by state regulatory agencies from Texas to New York, and by dozens of solar and other energy equipment manufacturers and utilities and retail electricity providers. He has provided testimony in a variety of state and provincial hearings as an expert witness on data development and forecasting issues. He published “Energy Budgets at Risk (EBAR): Risk Management Approach to Energy Purchase and Efficiency (Wiley, April, 2008),” the first extension of risk management principles to evaluate building energy efficiency investments. He received a patent in 1995 for a drill-down and data visualization technology that has been licensed by Microsoft, Oracle, SAP and every other major business intelligence software provider. He holds a Ph.D. in economics from the University of Florida. Previous positions include signature professor at Texas A&M University, Chief, Applied Research Divisions at Georgia Tech Research Institute and economist at Oak Ridge National Laboratory and the Federal Reserve Bank of Chicago. Click Here to Download the 5 Page PDF Whitepaper |
Other MAISY Financed Emissions Accounting Data and Services Topics |