MAISY Residential and Commercial Energy Use and Hourly Load Database Details, Questions and Answers |
MAISY Detail, Questions and Answer Links
Data Sources and AI Reconciliation: MAISY databases are availalble for any geograp MAISY databases are compiled from dozens of data sources including
AI methodologies include KNN nearest neighbor algorithims with machine learning, regression, and Maximum Likelihood refinements. The Database Development Process Each database development includes four steps:
MAISY Database Accuracy/Comparison With Other Commercial and Residential Energy and Hourly Load Data SourcesAccuracy: It is not possible to calculate MAISY multi-source statistical data accuracy with classical statistical approaches; however, our experience indicates that variables of primary interest to our clients are typically within a (+/- ) 10 percent confidence interval. These observations are based on applications for utilities where MAISY data have been evaluated against actual utility customers. MAISY databases are validated against a variety of sources including utility energy use and load data, load research data, FERC and EIA filings and more.Comparison With Other Energy Use and Hourly Loads Data Sources: The only other US data sources drawing on individual utility customer data and encompassing the entire country is the Department of Energy EIA's RECS (Residential Energy Consumption Survey) and CBECS (Commercial Buildings Energy Consumption Survey) surveys. While CBECS data are useful for some national and regional analysis, small sample sizes, large standard errors, lack of sub-region geographic detail, errors in modeled end-use energy use data, dated information, and limited coverage provide a questionable basis for using these data sources for most market and sales analysis, product development and design and other applications. For example, While the Department of Energy’s CBECS survey documentation reports 95% confidence intervals of +/- 8 percent for total US commercial buildings electricity consumption; drilling down to individual buildings (e.g., office, retail, etc.) yields 95% confidence intervals greater than +/- 25 percent for half of the sixteen building types. Drilling down to smaller geographic areas provides even less accuracy. For example, the 95% confidence interval for major fuels consumption in the West census region is +/- 67% for more than half the sixteen building types (e.g. food sales is +/ 84%). Applying these data means that, for example, food sales fuels consumption likely range is between 0.012 and 1.84 times the CBECS estimate. Drilling down for more detail results in even greater confidence ranges rendering results from these national surveys of limited use for geographic areas smaller than the nation as a whole. The most recent 2020 RECS (residential) survey (final release, June 2023) has an expanded sample of 18,400+ household records and provides state-level identification of each record. This sample size extension greatly expands the applicability and reliability compared to previous RECS surveys that collected data from approximately 5,000 households. However sample size limitations on drill-down analysis should still be recognized. In addition, a variety of the end-use energy use estimates within this database have been identified as innacurately estimated, a situation that is corrected in the new MAISY RECS Database. A new MAISY Database product ( MAISY RECS , introduced in February 2024, extends the RECS database to include household emissions and 8760 hourly whole building and end-use electricity kW loads. In addition, some out-of-bounds end-use energy use data items have been reestimated with and AI process. For applications that require greater segmentation or geographic detail below the state level, the 7+ million household records and ZIP detail in Standard MAISY Residential Databases support these extended analyses. The Critical Issue of Sample Size in Drill Down Accuracy Drill-down accuracy of CBECS and RECS survey data is primarily a function of the number of sample records in the drill-down segment of interest. CBECS drill-down accuracy declines significantly with just a few drill-down as ~5,000 customer records is sliced and diced. While the 18,400+ record RECS survey sample is almost four times that of CBECS, state-specific samples range from about 300 to 1100 records so state-level drill-down accuracy may also be limited more than realized for state-level analysis. MAISY Databases provide significantly greater accuracy for drilldowns of more than several layers because of larger sample sizes and greater geographic detail. For example, a special extraction of residential customer records for a major manufacturer provided 50,000 statistically representative customer records for the Los Angeles metropolitan area and the same number for the San Francisco metropolitan area. By reconciling and applying AI to integrate a variety of customer data sources, determining population characteristics, and applying a robust sample design, MAISY databases are able to deliver reliable detailed utility customer energy use and characteristics for small geographic areas and detailed customer segment specifications. MAISY data reconciliation recognizes and adjusts for weather differences, data collection strategies and sample designs, sampling error and other issues that arise in integrating multiple data sources.
One OpenEI source provides commercial and residential engineering model-based hourly
8760 load results for various weather locations for a limited set of
commercial (16) and residential (3) building model input assumptions that typically do a poor job of
reflecting the population in any actual geographic area
and cannot reflect the diversity of customers in market segments of
interest (e.g., income, dwelling unit size, etc.).
|
|
|
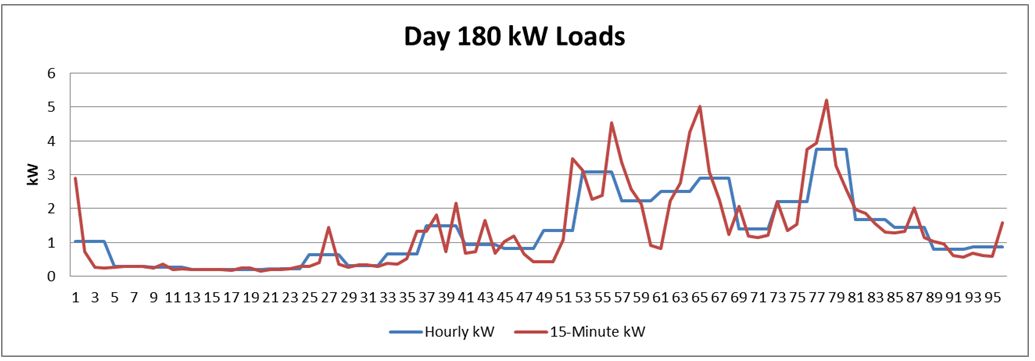
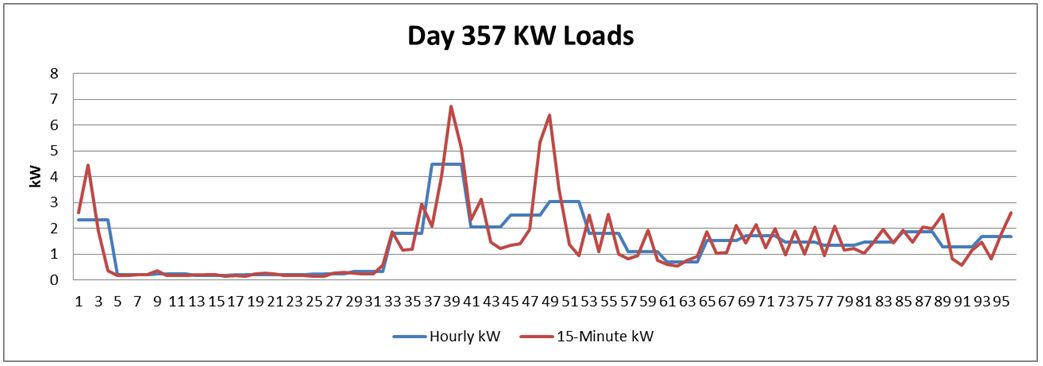
Load data are weather-adjusted to reflect normal hourly weather data. Users can access and evaluate hourly loads for individual customer records or for any grouping of customers defined by database variables (e.g., heating fuel, business type, square feet, number of children, etc.) The large number of customers in the databases and the database design permits users to develop hourly load information for detailed customer types and market segments based on relevant customer characteristics.
![]() More Detail on 8760 MAISY Hourly Loads Detail and Client Hourly Load Applications
More Detail on 8760 MAISY Hourly Loads Detail and Client Hourly Load Applications
![]() More Detail on MAISY kW Loads (hourly , 15-minute, etc.) and
Client Hourly Load Applications
More Detail on MAISY kW Loads (hourly , 15-minute, etc.) and
Client Hourly Load Applications
![]() Options for Custom Hourly Loads Databases
Options for Custom Hourly Loads Databases
MAISY Excel Energy Use and Hourly Load Workbooks
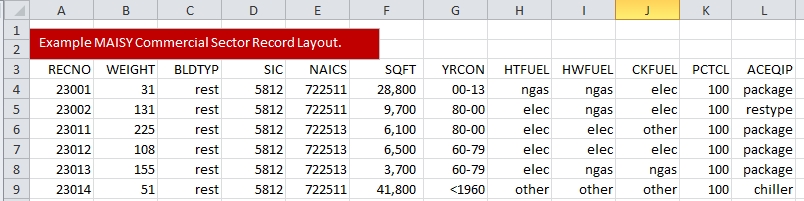
MAISY databases are provided in CSV formats and Excel workbooks. Each individual database record occupies one row of a worksheet. Each column in the row contains a value for a single variable. For databases that include hourly load data, the right-most columns include either month/day type load profiles or full 8,760 or 15-minute weather-adjusted hourly loads.Each record contains a population weight that reflects the number of customers represented in the geographic area population (i.e., a weight of 31 means that particular customer represents 31 customers in the geographic area, with the same customer characteristics). Summing weights for a particular segment provides an estimate of the total number of customers in that segment. The Excel sumproduct formula can be applied to the weight column and other data columns to develop estimates of segment totals for that data item. For example, applying a sumproduct formula to the weight and annual kWh column provides total electricity used in the customer segment.
Drilling Down in MAISY Databases
MAISY databases have been developed with over 7 million utility customer records specifically to support energy use and energy-related analysis of user-specified, detailed customer segments (e.g., households in Dallas, single family dwelling units with incomes less than $25,000, small office buildings with electric space heating built before 1980, and so on).This deep drill-down capability is provided by a database sample design that reflects knowledge of our clients' applications.
For example, if the population of customers includes a 10 percent electric space heating saturation, a random sample of 2000 would provide only about 200 electric space heating customers. However, with 20 commercial building types, the confidence interval around building-information would be quite high especially when one drills down to evaluate electric-heated buildings in different size categories.
We know that electric space heating customers are of interest to our clients' applications so we boost the number of electric space heating customers pulled from the master MAISY database to ensure that users can conduct multiple drill downs on electric space heating customers with confidence. We apply the same criteria with other important customer variables. MAISY database record weights automatically adjust for this oversampling so that total customers, energy use and other customer segment characteristics always correctly reflect population values.
Customer Segment Databases
MAISY Utility Customer Databases can be provided for customer segments of interest. For example, a market analysis focused on the San Francisco market could include customer information on single family owner-occupied homes for customers with incomes of $100,000 or more and annual kwh use of more than 10,000 kWh. Master databases consisting of more than 7 million US utility customers provide more than enough detail to drill down to any client-specified customer segment. Individual utility customer records are extracted, processed and utility customer information is processed to reflect customers within each client-desired customer segment.Customer segment database information supports new technology product development and market assessment, marketing and sales market sizing and evaluations, and other applications that utilize information on markets and market segments.
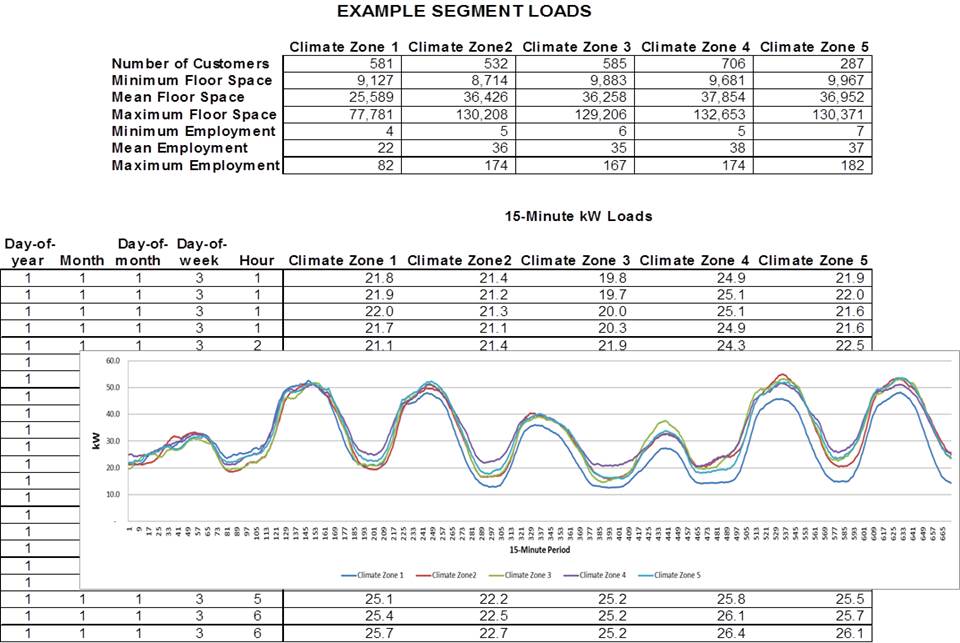
In addition to electric load data, additional information is provided for each segment including number of customers and average or typical characteristics of customers in each segment. The table below illustrates typical detail associated with both Commercial and Residential Databases.
Segment definitions (e.g., ranges of floor space, peak kW, annual kWh, household income, geographic areas, etc.) are determined in collaboration with JA clients to meet technology development and/or marketing needs.
Segment versus Customer Data discusses how to determine the best customer information development strategy: considering segment versus individual customer databases
What Questions Can Be Answered With MAISY Energy Use and Hourly Load Databases? Some Examples:
- How do hourly or 15-minute load profiles vary across customer segments and what are the impacts on product design and system cost?
- How do customer financial benefits vary across customer segments?
- Which customer segments should marketing and sales campaigns focus on to offer the greatest customer energy bill savings?
- What customer characteristics are most closely associated with the greatest energy bill savings?
- What operational strategy maximizes customer electric bill savings given utility rate structures and incentives?
- How many potential customers are associated with different customer segments?
- What are the implications of load profiles on technology performance, control strategies, lifetime, and other operating and maintenance issues?
- What segment-specific load profile characteristics should be considered in targeting marketing material
MAISY Individual Customer Data Versus "Prototype or Typical" Data
The MAISY system permits users to select individual customers or customer segments based on dozens of customer characteristics. Pick any combination of business type, floor space, operating schedules, space heating fuel, year of construction and many other variables to zero in on a specific customer type or market segment.What about other load-profiling systems that offer 12, 36 , 75 or some other limited number of fixed customer segments? To represent 13 commercial business types; electric, gas and oil heat; small, medium and large buildings requires 117 prototypes or "typical" buildings. Add in age categories and more than 200 "fixed prototypes" would be required, well beyond the scope of these "fixed" systems.
Residential prototype databases provide the same segmentation limitations. Three dwelling unit types, three dwelling unit sizes, 4 dwelling unit ages, and 4 income categories, a similar segmentation applied in previous MAISY applications, would require a database with 144 distinct prototype households which again is well beyond the capacity of most existing "prototype" databases.
Recently-developed NREL RESSTOCK databases provide an engineering-based household database of nearly 1 million individual household records representing households across the US. The total number of records was presumably generated to overcome the segment-sample size issue described above. However, full database application/analysis is complicated, requiring application of a programing language. Data queries are suggested to "use at least 1000 samples to maintain 15% or less sampling discrepancy for common quantities of interest. Queries in sparsely populated areas or with filters applied may have relatively few samples available. In these cases, samples from similar locations can be grouped to increase the sample size."
Additionally, the RESSTOCK database:
- is composed of engineering-based model results with the limitations of modeled data described in a previous section above,
- requires filtering with assumptions on low, medium or high energy use levels for various end uses,
- reflects a 2018 base year, and
- does not provide EV charging loads.
The main RESSTOCK Web pages provide only limited detail on database applications. The RESSTOCK Q&A page provides a quick source of descriptive information.
Relying on "prototype and typical" is similar to analyzing a "typical" family which consists of two adults and 0.6 children - it may reflect an average but it may also provide misleading results when used to understand customers and markets, to develop programs to fit the needs of individual customer segments, to evaluate the profitability of serving these customers or to evaluate markets for new technologies.
Sources of load profile data that rely on fixed customer segments typically develop hourly load data with engineering models (e.g., DOE2, OpenEI, NREL) of a single "prototype" building. The aggregate nature of these representations misses the variation that exists among individual buildings and households within these segments, hiding important market information. For instance, a particular electric rate structure may provide a competitive profit based on an entire segment's single prototype load profile; however, analysis of subsets of the segment (which can be performed with MAISY but not with the "prototype or typical" load profile approach) may reveal significant diversity in profit levels across customer sub-segments such that some customers are provided power at a loss while profit margins on other customers result in cream-skimming targets for other suppliers.
Similarly, evaluating markets for new technologies or potentials for energy efficiency initiatives requires consideration of the full range of customers within a market or utility service area. The average load profile may reflect little potential hiding the fact that a significant portion of the market with different load characteristics provides great potential.
For more information on this topic see Avoiding "Prototype" and Average Load Data Aggregation Errors .
Do MAISY Databases Provide EV charging loads?
MAISY EV Hourly Charging Loads Databases are the first resource to provide a comprehensive small-geographic data (ZIP-level) on both current and future potential EV charging loads. Databases encompass the entire US with forecasts of future potential EV ownership and charging loads.The EV Hourly Charging Loads Databases are developed using AI applications to estimate EV ownership probabilities and to integrate MAISY Database household work commuting travel and charging loads from travel survey data from 300,000 households (including details on 1 million trips), and state/ZIP auto/truck registrations detail for individual PHEV and EV vehicles.
EV charging loads can also be included as an option in the standard MAISY Residential Energy Use and Hourly Load Databases>. This additional data items provides standard whole house hourly/15-minute loads for each household record along with whole house plus EV charging loads for the same record providing a comprehensive characterization of each household's contribution to system peak demand without and with the addition of EV chargers.
The new Smart Grid Research Consortium's Grid Impact Model (GIM) also incorporates EV ownership probabilities, whole building, and charging loads in 2030 and 2035 forecasts. The GIM also forecasts electrification, weather extremes and demand managment probram impacts for individual ZIP and neighborhood areas.
The GIM model is provided to individual electric utilities populated with actual utility-specific household data for immediate in-house applications in easy-to-apply Excel workbooks. GIM model development is supported by all consortium members avoiding the cost of expensive one-off consultant engagements.
Other MAISY Database Products

|
Click Here to see advantages of MAISY/SGRC data/analysis compared to Department of Energy, NREL and other engineering model-based sources. |