| MAISY AI ZIP-Level EV Saturation Model |
MAISY Agent-Based ZIP-Level Model Uses AI to Map Future Utility EV Distribution Challenges
Mapping Software Identifies ZIPs with Greatest Forecast EV ownership Increases
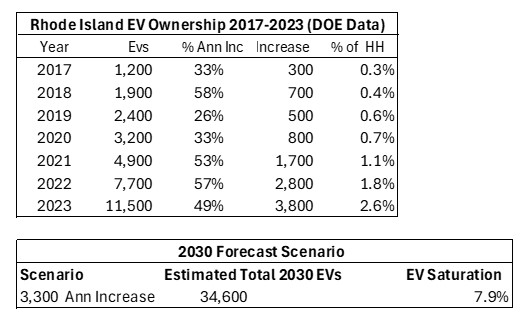
SummaryMost electric utilities are struggling to understand how the rapidly growing number of EVs (electric vehicles) will impact their distribution systems.Electric distribution systems step down higher voltage lines with transformers that then distribute power to dwelling units in a neighborhood. Adding just a few level 2 EV chargers in a neighborhood can cause low voltage, flickering lights, reduced transformer lifetimes and blown transformers. Many utilities are struggling to accommodate customer requests for level 2 charger installations. For example, the assistant director of Palo Alto utilities recently stated, “There are places even today where … we can’t even have one EV charger go in.” From 2021 to 2023 US EV ownership increased at an average annual rate of 47 percent to 4.9 million vehicles according to the Department of Energy. EV household saturation (EVs as a % of households) is about 2.7 percent. A National Renewable Energy Laboratory forecast estimates a household EV saturation of about 18.3 percent by 2030, a nearly 7-fold increase. This large increase in forecast EVs is supported by an April 2024 Gallup poll that found 16 percent of adults either own or are strongly considering an EV purchase with another 35 percent saying they might consider a future EV purchase. Utilities across the country are beginning to upgrade aging distribution systems to meet these new EV loads. However, the huge cost ($1 trillion dollars according to Lawrence Livermore Lab), means utilities will have to prioritize local area upgrades. Unfortunately, many utilities have no visibility on customers beyond the substation. To make matters even more difficult, utilities do not currently have a reliable way of estimating EV growth in different distribution areas. This paper describes a new AI agent-based (AI-AB) model that, for the first time, provides forecasts of future EV ownership within small geographic areas supporting EV-related utility engineering/planning decisions. The model is illustrated with a 2030 forecast of EVs for each Rhode Island ZIP code area. The forecast shows significant variation in growth of EV ownership across ZIP areas: information that can guide utility planning/analysis and upgrading of distribution areas most vulnerable to EV overloads. The MAISY AI agent-based model can be applied to any ZIP defined area (utility service area, state) for any year with additional census tract detail. The model applies an Excel user interface for familiar/easy applications of alternative forecast scenarios. Modeling ProcessThe MAISY AI agent-based model is intuitively appealing; behavior of each household (i.e., each agent) in a representative sample of actual households is modeled providing a forecast of the entire population of households. Data on each of the 19,000 Rhode Island households is extracted from the US Census Department American Community Survey (ACS) of actual households. Information on income, demographics, commuting characteristics, vehicle ownership, and other characteristics is available for each household record.An AI process determines the probability of EV ownership for each household in the ACS database. The EV purchase probability is estimated with an AI KNN “nearest neighbor” algorithm that draws on a separate household/EV (HH/EV) database of more than 26,000 individual households where each household record includes income, demographics, other variables and most importantly EV ownership. The KNN algorithm matches each ACS household with a group of similar households in the HH/EV database and calculates an EV ownership probability for the ACS household. EV distribution stress metrics. The most readily available measure of small area EV distribution stress is EV household saturation, that is, % of households with an EV. Other metrics that combine household saturations with hourly loads are described in a forthcoming paper. Summary Results2030 Rhode Island (RI) EV ownership forecast. The first table below shows the rapid growth of recent RI EV ownership, especially in recent years with approximately 50% annual increase in EVs over each of the three years from 2021 through 2023. The 2023 EV household saturation is 2.6%.The 2030 forecast assumes a conservative 3,300 EV annual additions (average of 2022 and 2023 additions). Even with this modest assumption, the number of 2030 EVs would triple by 2030. The MAISY AI-AB model allocates the increased EV ownership across households within the state based on household ownership probabilities and compiles the results for individual ZIP code areas. 
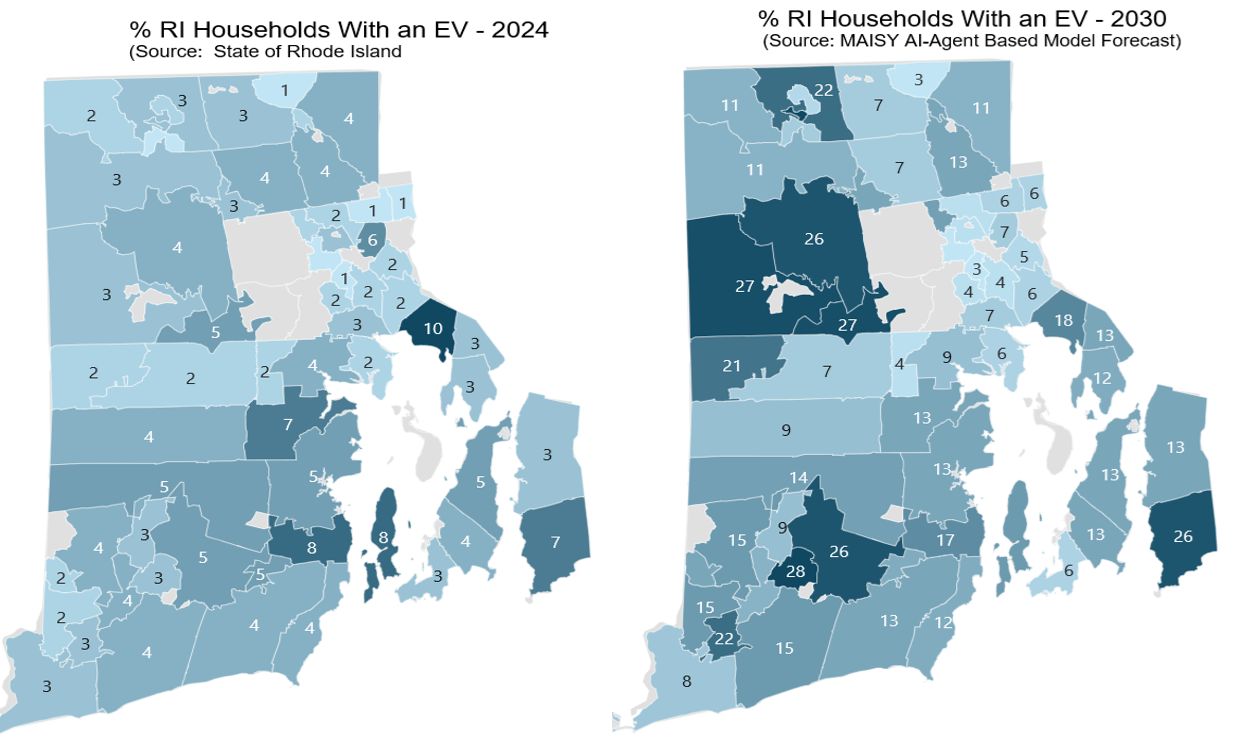
The actual distribution of EVs by ZIP code for 2024 (source: state of Rhode Island) reveals significant variations in ZIP EV household saturations across ZIPs ranging from 0 to 10.3 (ie., 10.3 percent of households own an EV within the ZIP code area). The 2030 forecast shows a significant variation in both the level and increase in household EV saturations across ZIPs over the seven-year forecast period. The maximum forecast ZIP saturation is 28 percent with 8 Zip codes (12%) above 25 percent. The average saturation is 12.24 with a quarter of ZIP codes less than 7 percent. This variation reflects ZIP-level diversity in distributions of individual income and demographic variables including commuting, householder ages, and other characteristics. 
Insights on the 2024 – 2030 EV forecast results. The two maps show that EV saturation forecasts in some ZIPs increased significantly, while some increased modestly and some stayed about the same. One take-away is that the current EV saturation in a ZIP code is not a good predictor of future EV saturation growth in that same ZIP. The reason for this disparity in EV saturation growth rates is that household populations within individual ZIPs have unique distributions in terms of income, demographics and EV purchase motivations; ZIPs with a greater fraction of “innovator” households may reflect a larger portion of EV owners in 2024 but then add fewer “early adopters” relative to the ZIP household population. In other words, the growth in ZIP level EV ownership over time reflects the distribution of household characteristics/needs/wants within the ZIP areas. The AI model analysis component shows that income, householder age, commuting miles, educational achievement, number of vehicles in the household and several other household characteristics explain the likelihood that a household will own an EV. Furthermore, only a non-parametric AI estimation of that relationship can reliably capture the empirical relationship required to forecast future EV ownership. Study Take-aways. The MAISY AI agent based model applies actual income, demographic, commuting and other data on individual households across the US. An AI process is applied with a separate HH/EV database to estimate the EV ownership probability for each household. The household probabilities are applied to allocate future EV ownership across each ZIP code. The example Rhode Island application indicates that current EV ZIP saturations have limited prediction accuracy as a result of variation in EV ownership characteristics distributions within individual ZIPs. MAISY AI-Agent Based EV Model Owner Database/Forecast Client Options. The MAISY AI agent-based model is available for any ZIP defined area (utility service area, state) for any year. Additional census tract forecast detail is also available. Model software and data are embed in an Excel workbook providing access to input and output data along with user options to specify alternative forecast scenarios. |
Other MAISY Residential and Commercial Database Topics |