|
Financed Emissions Notes & White Papers |
Avoid ESG Reputational Risk With Indexed Emissions Intensity Measures
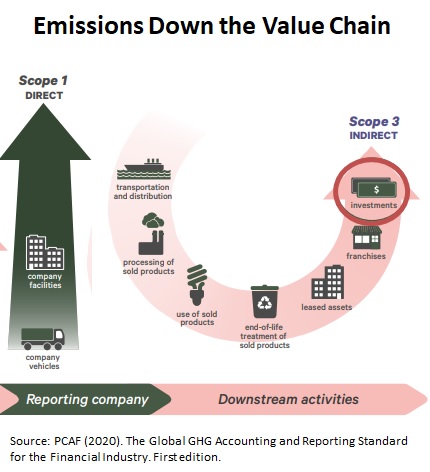
Click Here to Download the 2 Page PDF Whitepaper Summary. I recently downloaded a bank’s ESG report that revealed an unexpected annual increase in Scope 3 financed emissions intensity. The report narrative suggested that a change in one of the data inputs could be to blame. In fact, the increase was a result of a faulty emission intensity calculation, a result likely to befall other organizations that ignore complexities in calculating accurate emissions intensities. Emissions intensities (e.g., emission/mortgagor) are the most critical component of reported emissions. Annual comparisons provide stakeholders with a measure of an organization’s success in achieving emissions reductions targets. Inaccurate emissions intensity calculations can sabotage a firm’s public image by reflecting increased emissions intensity when the opposite is true. Or, in a worst-case scenario, result in an external audit showing that reported emissions intensity data are overestimating emissions improvements. Reporting annual emissions intensity data based on simple aggregated emissions is guaranteed to provide misleading results as illustrated in this note. While this discussion is oriented to financial institutions, recommendations for calculating unbiased emissions intensities apply to all ESG emissions intensity calculations. Emissions Calculations. PCAF (Partnership for Carbon Accounting Financials) recommended financed emissions equal the product of energy consumption for each loan customer’s building times an emission factor times the loan balance divided by loan origin property value. PCAF recommends using the most disaggregated energy use data currently available, which for US financial institutions is either segment-specific ZIP averages or individually estimated customer energy use based on financial institution loan customer data (see below). 
Emissions Intensity Calculation Challenges. The most critical reported emissions data is the annual emissions intensity statistic used to compare financed emissions from one year to the next. The emissions intensity statistic applies emissions data calculated from the above equation. However, aggregating loan customer emissions into an accurate and unbiased representation of emissions intensity is a much more challenging computational process than expected. In our earlier paper we calculated a financed emissions intensity for a hypothetical bank with customers in both CA and AZ with a growing AZ market share. Outstanding loan amounts declined by 5 % and average new customer emissions declined by 10 % suggesting a significant improvement in emissions intensity. However, emissions/mortgagor increased year-over-year by 10%. Digging deeper into the data reveals the cause of this unexpected result is average AZ mortgagor CO2e emissions 2.6 times that of similar CA customers – a factor that overwhelmed loan balance reductions and efficiency increases. AZ electric generation uses more fossil fuels and households use more electricity. The 10% increase in emissions intensity clearly misrepresents the bank’s efforts and achievements in reducing emissions. Correcting this misrepresentation requires calculating an emission intensity that reflects changes in the relative importance of CA and AZ market segments. A weighting process like that applied in US Commerce Department price indexes should be applied to ensure accurate emissions intensity calculations. Price Index Methodologies. Price indices apply calculation methodologies designed to provide objective price comparisons over time. For example, one can calculate the increase in household food prices by calculating the cost of a current market basket of food items purchased today and dividing by the cost of that same market basket using last year’s prices. An algebraic representation of this calculation for the CA-AZ emissions intensity example is: 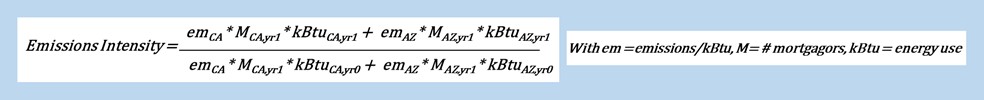
Emissions Intensity Index-Based Example. 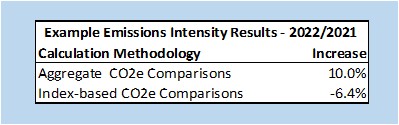 Calculating the CO2e emissions intensity using a price index methodology provides a more accurate estimate of annual reduction in emissions intensity as shown in the table below. The correct index-based emissions intensity declined by 6.4 % compared to the gross estimated increase of 10 % calculated above.
A shift in intrinsic characteristics (i.e., immutable characteristics like living in CA or AZ) of the mortgagor population shouldn’t impact the intensity measure; otherwise, financial institutions would be incentivized to unfairly discriminate among mortgagor segments based on intrinsic factors that are not under control of their customers. Customer segment characteristics should be identified before developing an emissions intensity index methodology that will provide accurate unbiased data. These include the relative importance of all-electric buildings, new construction versus existing buildings, solar installations, CRE business type and other factors. The indexing methodology shown above is called a Paasche index which uses current year segment populations. Several other indexing methodologies should be considered; the important take-away is that only an index-based methodology with appropriately defined customer segments will provide an objective emissions intensity appropriate for year-to-year emissions intensity evaluations. What Data and Level of Detail for Emissions and Emissions Intensity? Scope 3 household and firm emissions reporting and intensity statistics should include appropriately segmented ZIP level data or preferably individual AI-based customer energy data to provide temporally consistent emissions intensities. Using regional, state, or other aggregate data will not accurately reflect underlying changes in customer emissions characteristics leading to biases in reported emissions intensity statistics. ( Click Here to view a more detailed discussion of topics in this note including a discussion of ZIP-level versus individual AI-based customer data). Take-Away. Calculating emissions intensities designed to assess corporate ESG emissions achievements over time is a much more complicated process than simply reporting aggregate emissions. Inappropriate emissions intensity calculations can easily underestimate or overestimate corporate efforts to reduce client emissions. The worst potential outcome is a hit to corporate ESG reputation if an audit of corporate ESG reporting finds reported emissions intensity improvements were incorrectly calculated showing inflated emissions intensity improvements. About the Author. Jerry Jackson is a Ph.D economist who provides consulting services to clients concerning energy data and analysis and scope 3 residential and commercial firm emissions data. He is the author of the widely used 7+ million record MAISY Utility Customer Energy Use and Hourly Loads Databases. MAISY databases are available as Excel files or accessed online with an API to provide an unlimited number of individual customer energy use and emissions estimates. The API applies an AI K-nearest neighbor machine learning statistical estimation process to match individual customer inputs (e.g., ZIP code, household members, etc.) with the closest MAISY record to estimate each customer’s energy use and emissions. His clients include more than one hundred private companies, state and federal agencies. He can be reached at jjackson@maisy.com Click Here to Download the 2 Page PDF Whitepaper |
Other MAISY Financed Emissions Accounting Data and Services Topics |