|
EV Hourly Charging Loads Databases |
Hourly Charging Loads Databases for Individual US EV/PHEV Owners and Potential Owners
|
Federal government EV purchase incentives along with a growing charging infrastructure
and future lower price points are expected to
significantly increase EV ownership and charging loads (we are including both EV and
PHEV (plug-in hybrid electric vehicles) in the term EV hereafter). These market
changes create new challenges for electric utility distribution systems,
public charging station installation strategies, and impacts on microgrids.
MAISY EV Hourly Charging Loads Databases are the first resource to provide a comprehensive small-geographic data (ZIP-level) on both current and future potential EV charging loads. Databases encompass the entire US with forecasts of future potential EV ownership and charging loads. The EV Ownerhsip and Hourly Charging Loads Databases are developed using AI applications to integrate MAISY Database household work commuting travel and charging loads from travel survey data from 300,000 households (including details on 1 million trips), and state/ZIP auto/truck registrations detail for individual PHEV and EV vehicles. This process is illustrated in the schematic below: EV ownership Each record includes an AI KNN estimated household EV ownership probability. EV ownership and charging hourly loads can also be provided as optional data items in the MAISY Residential Energy Use and Hourly Loads Databases which include household income, demographics, building, appliance, CO2e emissions, energy use and prices and other data items for each of the 7+ million individual US household records. 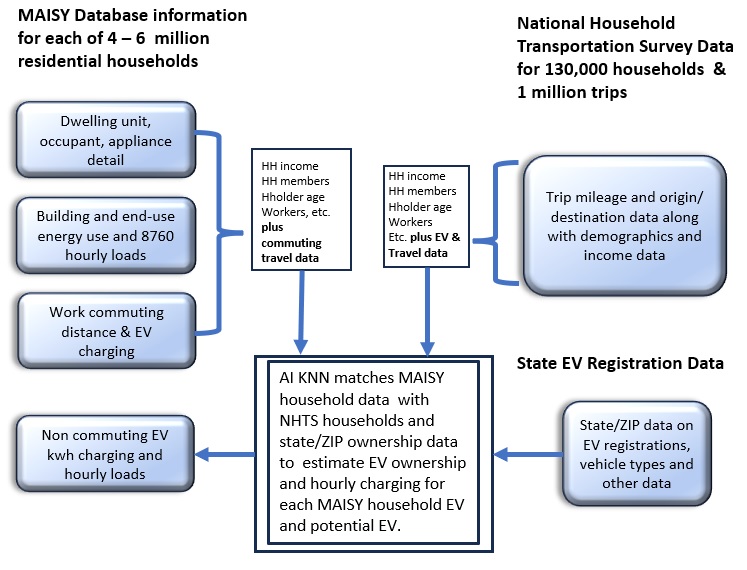
Summary: EV Hourly Charging Loads Databases
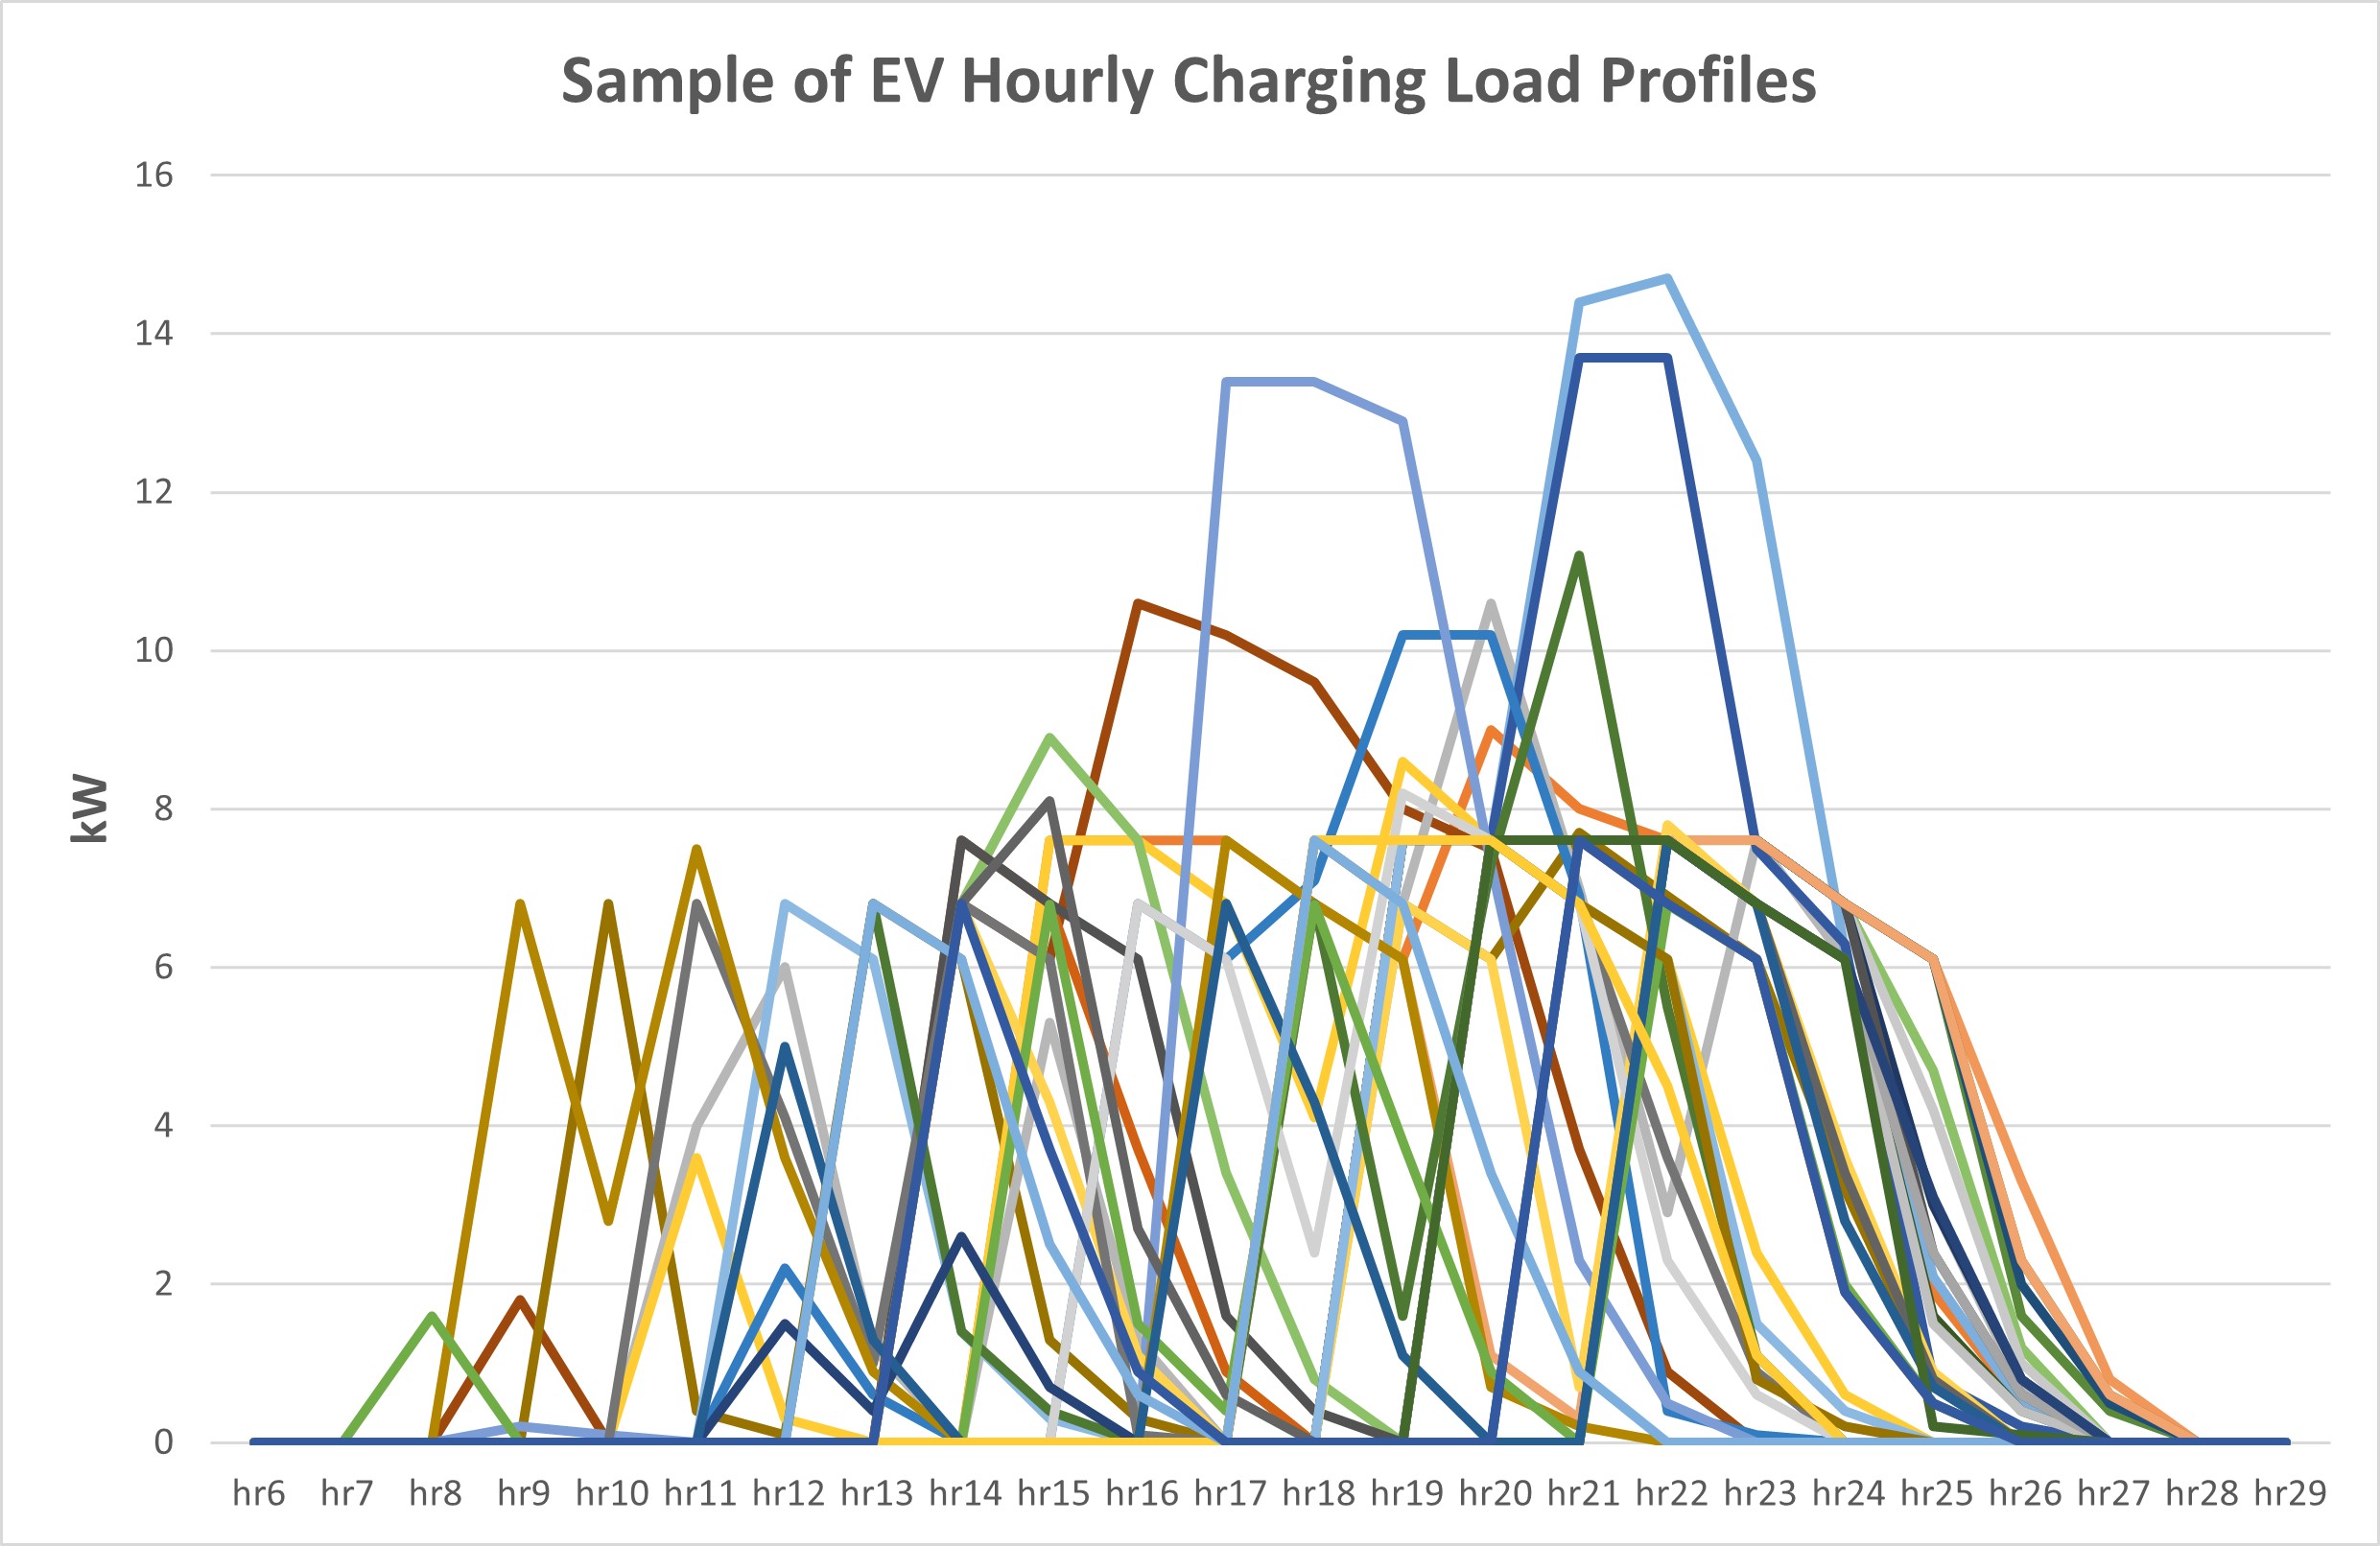
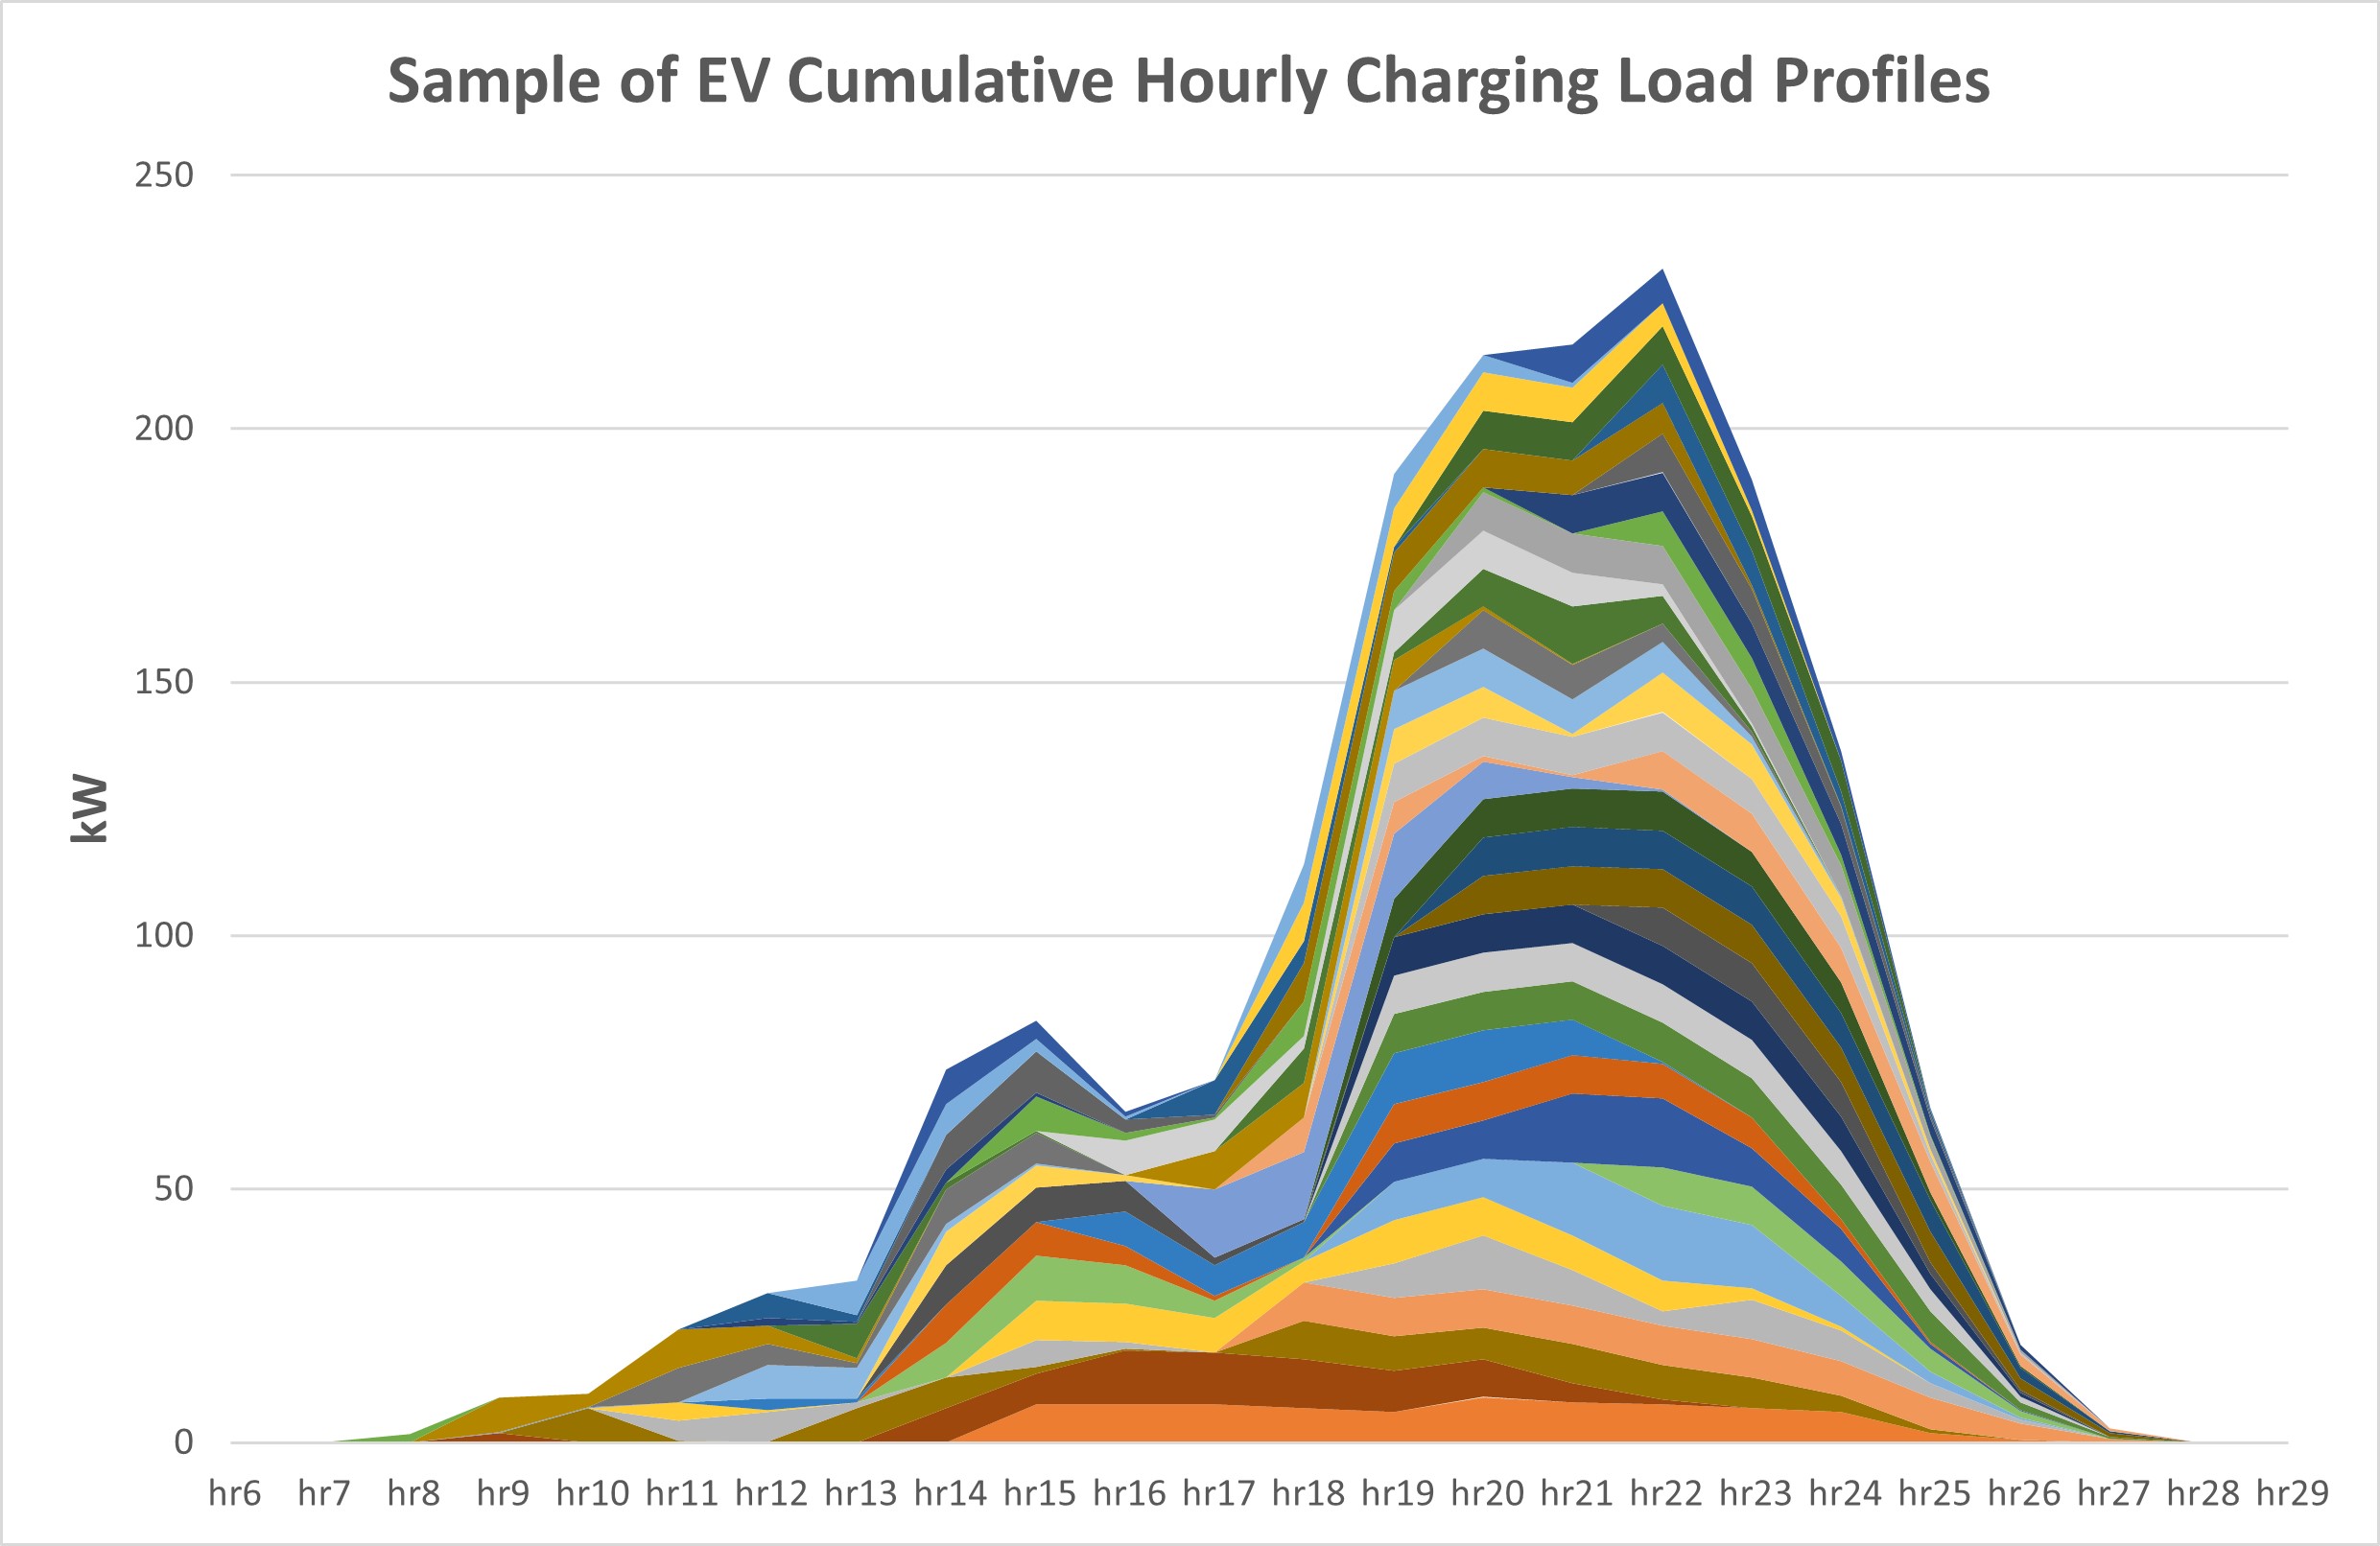
Three potential ownership categories are 1- unlikely, 2- moderately likely, and 3-highly likely. Providing hourly loads for current owners and for three potential ownership categories allows users to quantify the likely impact of increasing ownership over time. Vehicle owner demographic and income characteristics provide users with the ability to do what-if scenarios with their own EV adoption assumptions. Ownership and potential ownership designations are based on statistical analysis of data on over 6,600 PHEV and EV owners across the US. Example EV Hourly Charging LoadsThe chart below on the left shows individual charging loads for a sample of household EV/Phev owners. The chart on the right reflects cummulative loads from all the EV/PHEV owners included in the left chart.
MAISY EV Hourly Charging Loads Database Record Data ItemsFor each household: Identification of an EV owner or potential owner along with:
Two recent papers illustrate insights provided with the MAISY EV Databases
|
 Most electric utilities are struggling to understand how the rapidly growing number
of EVs (electric vehicles) will impact their distribution systems. Adding just a few level 2
EV chargers in some neighborhoods can cause low voltage, flickering lights, reduced transformer
lifetimes and blown transformers.
Most electric utilities are struggling to understand how the rapidly growing number
of EVs (electric vehicles) will impact their distribution systems. Adding just a few level 2
EV chargers in some neighborhoods can cause low voltage, flickering lights, reduced transformer
lifetimes and blown transformers. 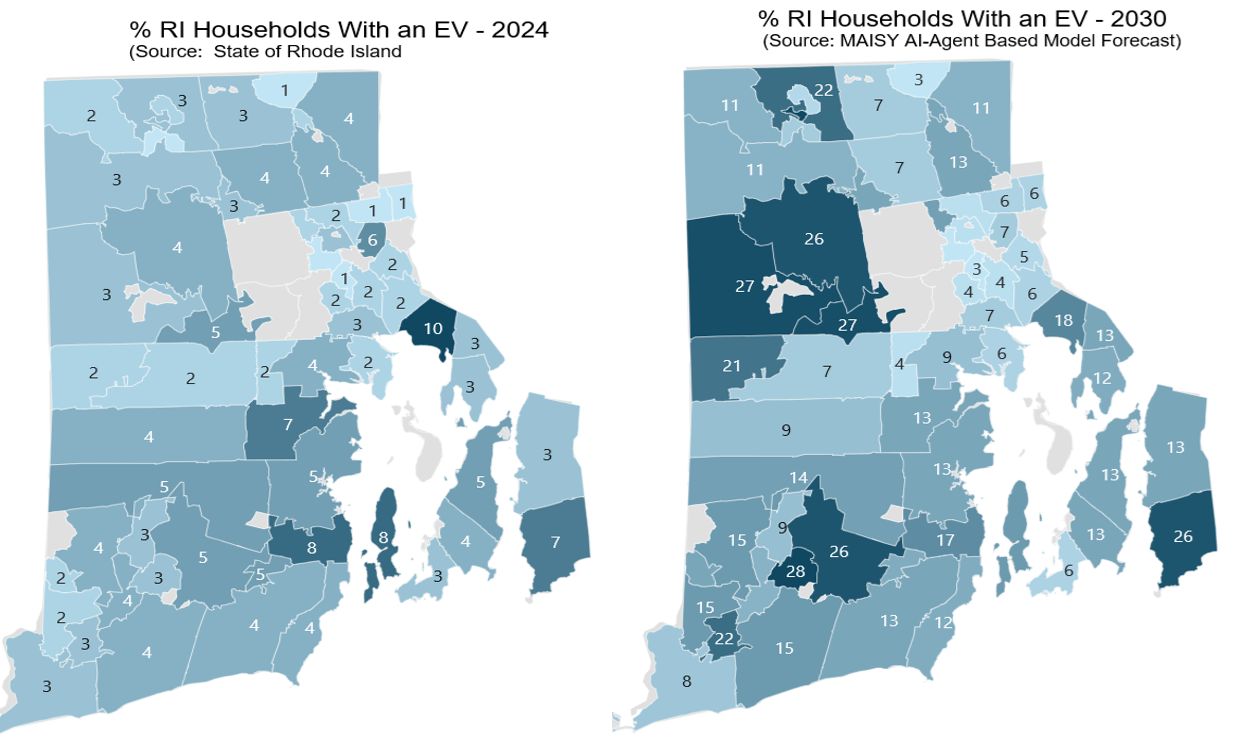 Most electric utilities are struggling to understand how the rapidly growing number of EVs (electric vehicles) will impact their distribution systems. Adding just a few level 2 EV chargers in some neighborhoods can cause low voltage, flickering lights, reduced transformer lifetimes and blown transformers.