|
Inflation & “Seriously Delinquent” Mortgages |
White Paper: Inflation Will More Than Double “Seriously Delinquent” Mortgages in 2023,
Jerry Jackson, Ph.D., January 24, 2023

 Follow @maisyenergydata
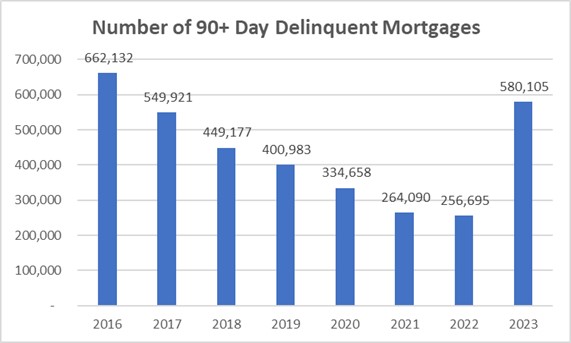 A new study predicts household inflation will more than double seriously delinquent mortgages by the end of
2023 to 580,000, a level not seen since 2016. Mortgages that are 90+ days or more in arears are considered
“seriously delinquent” and usually trigger lender foreclosures.
A new study predicts household inflation will more than double seriously delinquent mortgages by the end of
2023 to 580,000, a level not seen since 2016. Mortgages that are 90+ days or more in arears are considered
“seriously delinquent” and usually trigger lender foreclosures.
2023 will be the year that households exhaust Covid income payments and increasingly rely on credit cards and consumer loans to maintain living standards in the face of 40-year high inflation. Unfortunately, 580,000 households will no longer be financially able to make timely mortgage payments with 90+ day delinquencies jumping from 257,000 in 2022 to 580,000 in 2023 as shown in the chart. This level of delinquencies will impact more than 1.6 million household members. (Data source: US Consumer Financial Protection Bureau (CFPA) through 2022:Q3 with 2023 predicted results from this study. The CFPA data are the most authoritative source of national closed-end, first-lien, 1–4 family residential mortgages.) Reductions in 90+ days delinquencies from 2016 to 2019 reflected a booming economy with a real income (adjusted for inflation) increase of 7.8 percent and a reduction in unemployment from 4.7 to 4.0 percent. Federal government COVID income policies generated $2.3 trillion in household income supplements in 2020 and 2021 (NY Federal Reserve) which along with forbearance and foreclosure moratoriums generated the historic decline in serious mortgage delinquencies shown in the chart through 2022.) Declining Covid Income Buffers and Deteriorating Household Finances Household savings rates ballooned because of COVID income supplements in 2020 and 2021. The chart below shows personal savings rates at 8.8 percent prior to COVID, surpassing 25 percent in early 2022 and falling to pre-COVID levels at the end of 2021. Since then, savings rates have continued to fall to a November 2022 rate of 2.4 percent. Rates below the 2019 level reflect a “dis-savings” as households draw down savings. 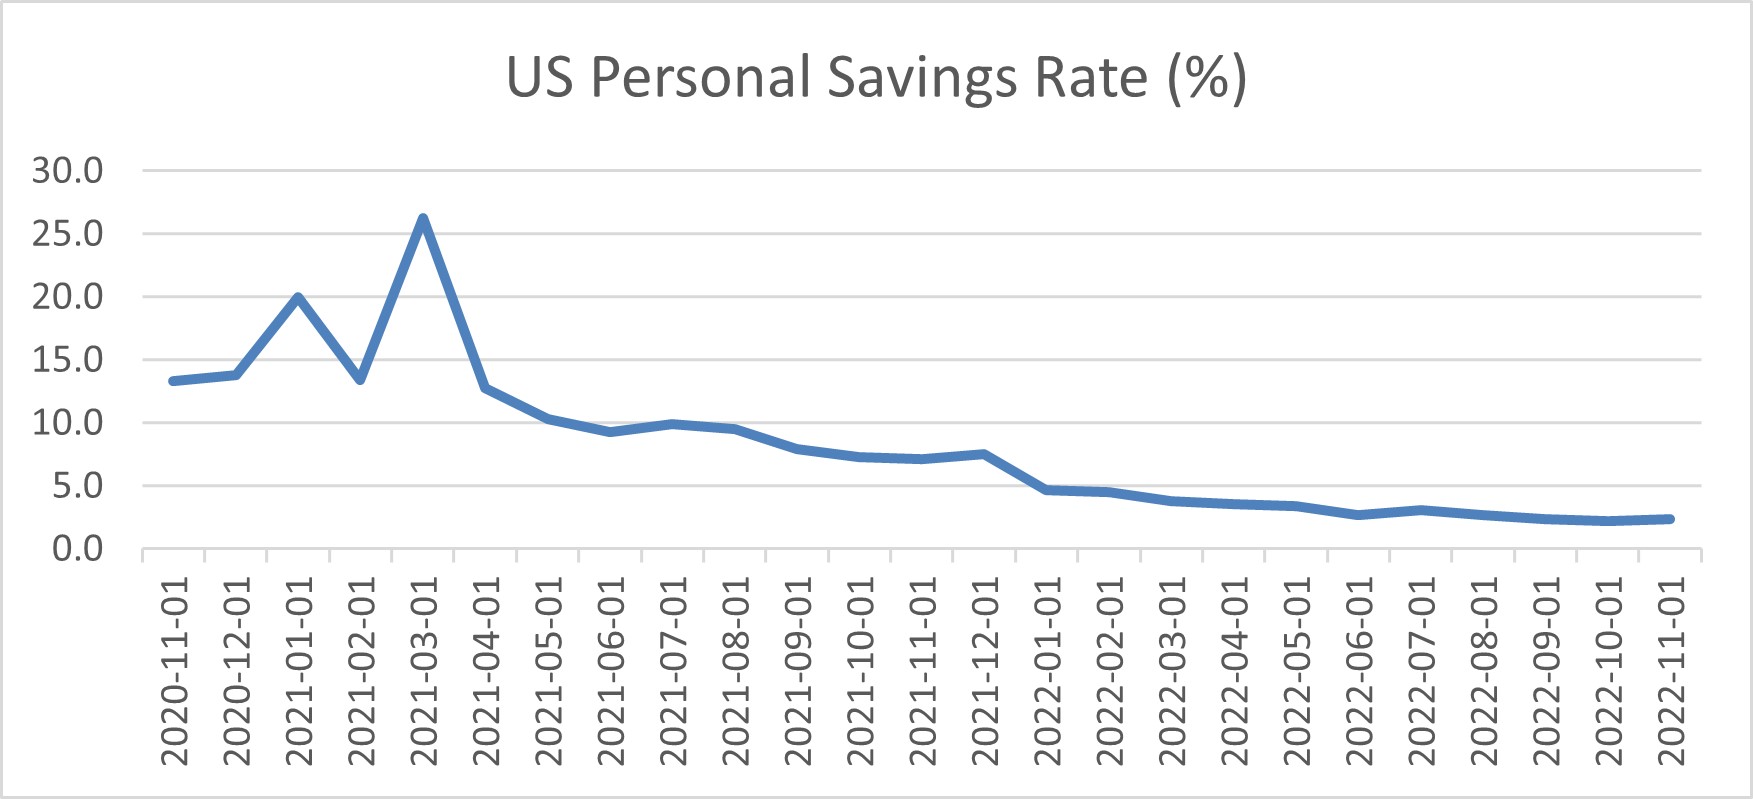
(Source: Federal Reserve Bank of St. Louis and U.S. Bureau of Economic Analysis) Industry experts including Moody’s Analytics and JP Morgan Chase agree that Covid-related household income benefits will have been exhausted anywhere from the end of 2022 to the middle of 2023. As excess savings are depleted, households are increasingly using credit cards and consumer loans to maintain pre-Covid lifestyles. Households will begin facing the unpleasant reality by mid-2023 that they are back in a pre-COVID financial position that has deteriorated because inflated costs of living have significantly outstripped wage gains. This grim reality is reflected in nearly every measure of household financial health. October 2022 credit card balances are up $16 trillion or 21 percent from their low in Q1, 2021. PYMNTS November survey finds 63 percent of consumers living paycheck to paycheck with the majority blaming inflation for their situation. For consumers earning more than $100,000 the figure is 47 percent. Vanguard reports 401K emergency financial hardship withdrawals are now the largest since 2004. Deteriorating household finances are evident in data on household utility and loan payment arrears. The National Energy Assistance Directors Association reported in November that about one out of six American families are behind in their energy bills with an average arrears of $788. Credit card, automobile, home equity and other consumer loan arrears are steadily increasing by the month. Extrapolating these series beyond 2022:Q3 shown in the chart below indicates that households will be in worse financial shape at the end of 2023 than before Covid began. 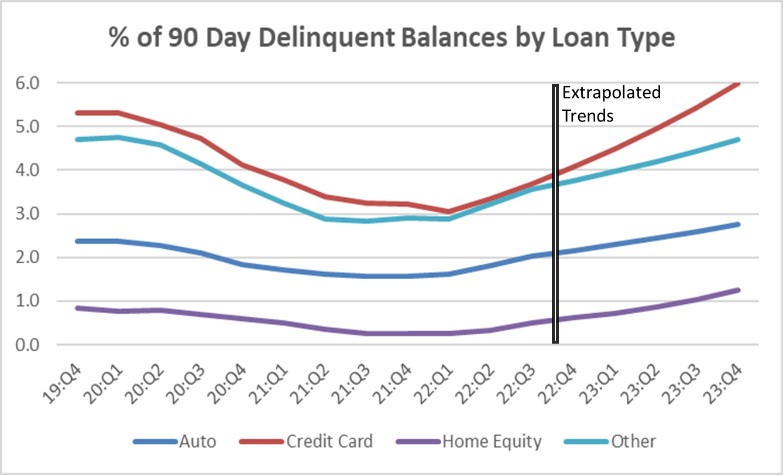
(Source: New York Federal Reserve data. Data are current through 2022:Q3. Estimates beyond that are based on linear trend extrapolations from 2021:Q4 to 2022:Q3 except for credit card extrapolations based on 2022:Q1 to 2022:Q3.) Data on Increases in “Seriously Delinquent” Mortgages Information from the NY Fed on new 90+ days delinquencies in the chart below shows the expected uptick in new seriously delinquent mortgage balances (rather than total 90+ days delinquencies shown in the first chart). This trend is evident in other data sources such as Black Knight, a mortgage industry intelligence firm, reporting in December 2022 that their “First Look at mortgage performance in November isn’t pretty, with signs that a growing number of homeowners are struggling with their mortgage payments.” Black Knight also reported an 11 percent increase in 60-day delinquencies and a 19 percent increase in foreclosure starts. 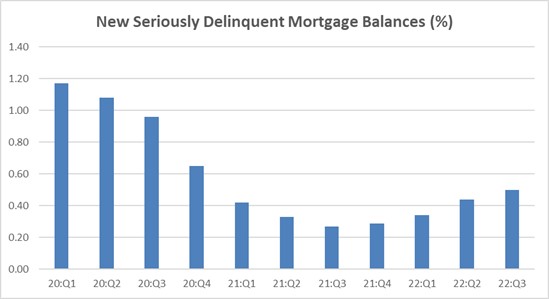
Source: New York Federal Reserve data. Forecast: 2023 Seriously Delinquent Mortgage Estimates 2023 seriously delinquent mortgages are estimated in this study using an econometric model based on mortgage delinquency data across 466 US counties provided by the US Consumer Financial Protection Bureau (CFPB). Additional information on data sources and a more detailed description of the modeling methodology are provided in a later section in this paper. CFPB data reflect counties with the largest number of mortgages reflecting approximately 75 percent of the first mortgage market. The forecasting model statistically relates the percent of 90+ day county mortgage delinquencies in 2019 to variations in county income and other socioeconomic variables. Net income loss (household inflation minus household wage increases) from 2019 to 2023 is calculated and applied with estimated model parameters to forecast the increase in county-level delinquencies likely to result from inflation impacts, net of wage increases. The average US household mortgagor net income loss is $16,442, - about 13 percent of average mortgagor 2023 household income or 1-1/2 month’s annual income. That is, even after accounting for wage/income increases, average mortgagor households will have lost the equivalent of 1-1/2 month’s income from 2019 to the end of 2023. US seriously delinquent mortgages are predicted to jump from 0.5 percent at the end of 2022 to an estimated 1.13 percent by the end of 2023 resulting in 580,000 delinquent mortgages as shown in the first chart in this paper. 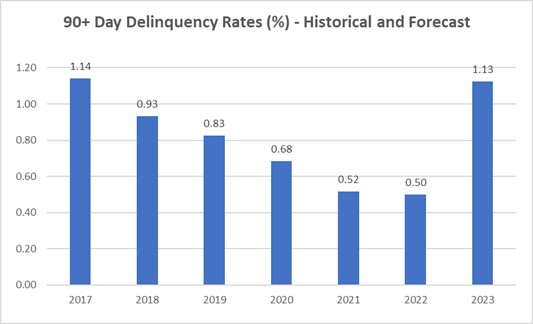
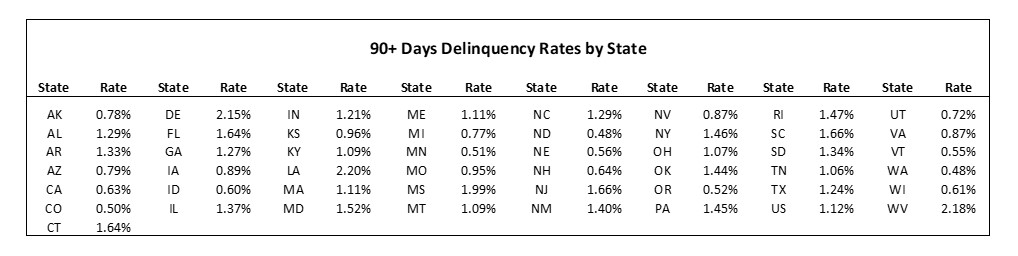
State Variations in Delinquencies State average 90+ day delinquencies range from 0.5 to 2.2 percent. Four states are expected to experience more than four times the current 90+ day US delinquency rate in 2023 including Louisiana, West Virginia, Delaware, and Mississippi. South Carolina, New Jersey, Florida, Connecticut, Maryland, and Rhode Island round out the top ten states, each equaling or exceeding three times the current 0.5 percent US average 90+ day delinquency rate. 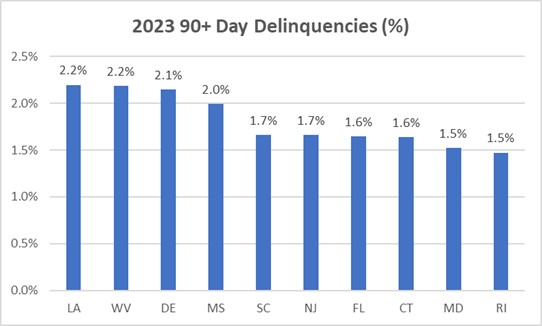
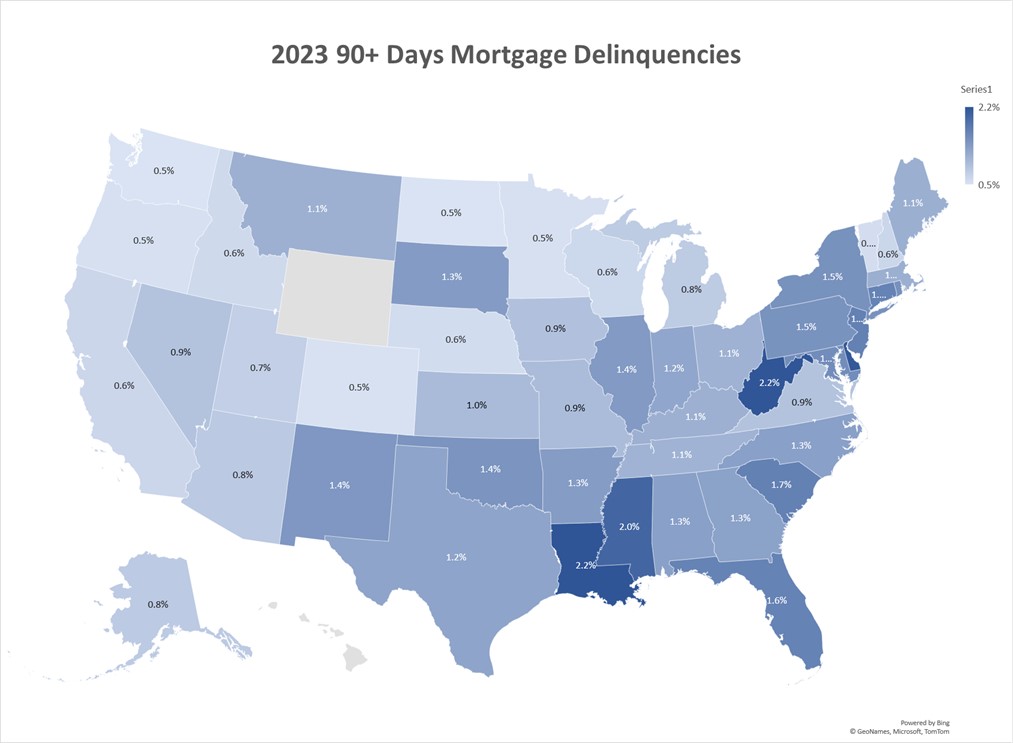
County Variation Within States Considerable county variation exists within states. For example, the Florida state estimate of 1.6 percent reflects county level estimates that range from 0.74 to 2.79 percent as indicated in the heat map below: 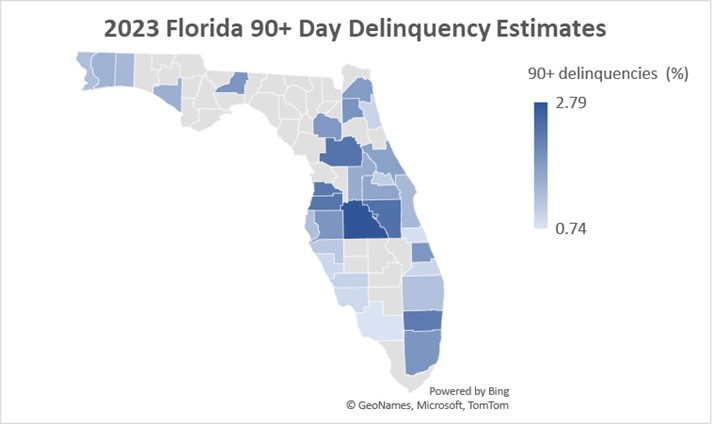
Counties presented in tan did not have 1,000 mortgage records considered sufficient by the US Consumer Finance Protection Agency to calculate statistically reliable delinquencies in 2019. County-level data for the 466 counties in this study is available from the author on request. Net income loss varies significantly by expenditure category and across counties. Net income loss for each of the three expenditure categories (utilities/commuting gasoline cost, food, miscellaneous) is calculated as the increase in each cost category within each county from 2019 to 2023 adjusted proportionately for increased median income in each county. For example, Florida county increases in utility/gasoline commuting costs range from $447 to $803, food costs range from $4,898 to $7,560 and miscellaneous cost increases range from $9,194 to $11,293. The chart below shows, as expected, delinquencies greater in counties with greater net income loss. However, variation in county-level income, household size, average dwelling unit age and other socio-economic factors create significant variation in this relationship for each income level. 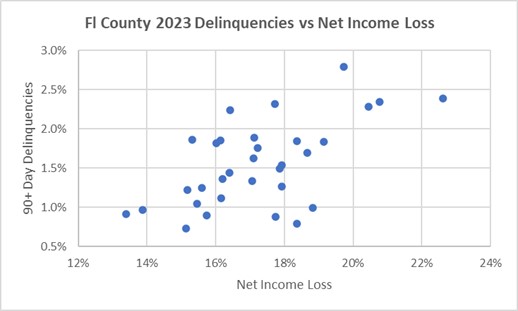
Comparing Florida 90+ day county delinquencies across median county income levels shows a general decline as incomes increase – that is, higher income households are better able to adjust to increased cost of living. However, counties with median incomes in the $80,000 to $110,000 range also exhibit significant variation in delinquencies because of the socio-demographic factors mentioned above. 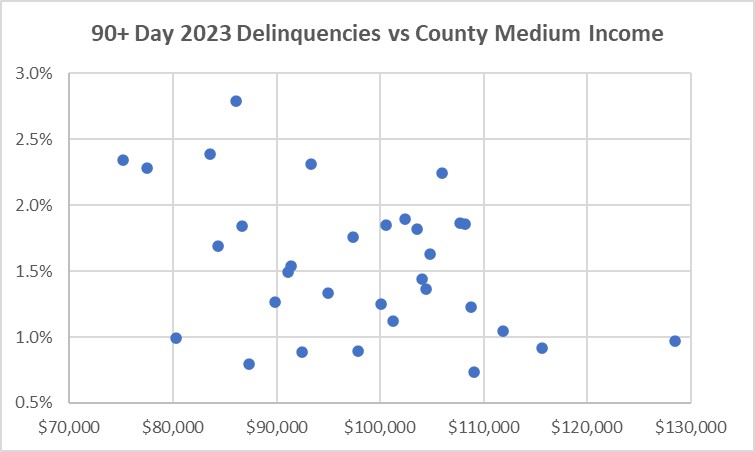
This brief look at predicted 2023 Florida county 90+ day delinquencies illustrates the complex nature of delinquency determinants and the resulting variation in delinquencies across the 466 counties included in this study. Additional predicted state and county mortgage delinquencies can be obtained from the study author. Methodology/Data Sources The analysis in this paper and the econometric model used to estimate 2023 seriously delinquent mortgages are based on the following observations:
About the Author Dr. Jerry Jackson is an economist and former Signature Professor at Texas A&M University, Chief of the Applied Research Divisions at Georgia Tech Research Institute and economist at Oak Ridge National Laboratory and the Federal Reserve Bank of Chicago. He counts more than 200 government and private organizations as consulting clients. He is also President of Jackson Associates (JA) and the author of MAISY Residential and Commercial Utility Customer Energy Use and Hourly Load Databases consisting of over 7 million customer records including individual customer annual, monthly and hourly energy use along with residential socio-economic and commercial business data items. MAISY data have been used by the US Department of Energy in analysis supporting appliance efficiency standards, by state regulatory agencies from Texas to New York, and by dozens of solar, CHP, battery and other energy equipment manufacturers, utilities and retail electricity providers. Dr. Jackson has provided testimony in a variety of state and provincial hearings as an expert witness. He holds a Ph.D. in economics from the University of Florida with specialties in econometrics and regional economics. Click Here for a partial list of JA clients. |
Related Topics |