Smart Grid Research Consortium 1.0 - A Look at the Smart Grid Investmente Model 2008 - 2018 |
Smart Grid Research Consortium 1.0 - Smart Grid Investment Model Backround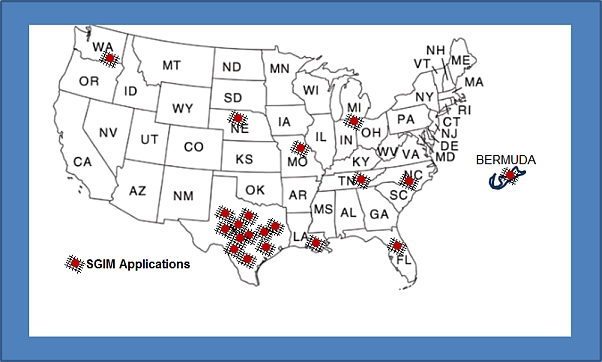
The lack of publicly available, independent, objective and comprehensive smart grid financial cost benefit financial models applicable to individual electric coops and public utilities in 2008 provided the motivation to develop the Smart Grid Investment Model (SGIM) through the Smart Grid Research Consortium (SGRC) developed at Texas A&M University. The SGRC transitioned to an independent research and consulting firm in January 2011. The SGIM was applied for more that two dozen individual utilities by 2018. SGRC staff worked with utilities to assist in evaluating individual smart grid investments, investment strategies and to apply the model to evaluate vendor proposals, to track investment costs and benefits and to provide other smart grid financial evaluations. By 2018 field experience with most smart grid technologies and programs provided utility decision-makers with reliable results to move beyond a model-based decision process. The SGRC 1.0 Smart Grid Investment Model has been superceeded in 2025 by The SGRC 2.0 Grid Impact Model to address EV, electrification and extreme weather impact threats to substation, feeder and transformer stability. By way of background, the remainder of this page provides a brief description of the SGRC 1.0 SGIM. Much of the analytical approach and Excel-based user experience developed for the SGI model is repeated with the new Grid Impact Model. SGRC 1.0 Smart Grid Investment Model (SGIM)TM Characteristics
SGRC 1.0 Smart Grid Investment Modeling ApproachThe Smart Grid Investment Modeling approach applied four basic steps to evaluate smart grid investment costs and benefits including:
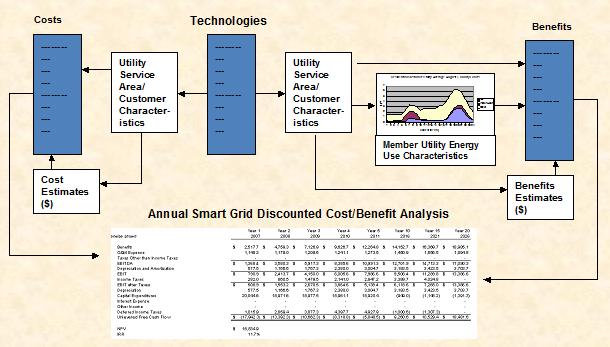
These steps are illustrated in the figure above. Importance of Customer Class/End-Use Load ProfilesSmart grid-related reductions in peak period hourly loads are a critical contribution to smart grid investment benefits for most utilities. Technologies such as direct load control and programmable communicating thermostats as well as programs such as critical peak pricing reduce peak period loads resulting in reduced power purchase, generation and transmission costs. However, these financial benefits vary widely across utilities depending on weather characteristics, air conditioning and water heating saturations, customer premise characteristics and other factors.Few electric cooperatives and municipal utilities have customer class /end-use (e.g., air conditioning) load profile information or forecasting models required to incorporate this dynamic element in a comprehensive cost-benefit analysis. Consequently, a priority task in implementing the Smart Grid Investment Model for each utility was developing a monthly kWh, peak demand and customer class/end-use hourly load profile forecasting and smart grid technology/program analysis model. This integration of energy and load profile forecasting models within a detailed smart grid cost benefit framework reflected a significant contribution to current state-of-the-art in smart grid investment analysis applications. Utilities were, for the first time, able to evaluate investment options considering alternative growth scenarios, impacts of existing utility and demand response programs, and impacts of non-utility programs such as changes in appliance efficiency programs. 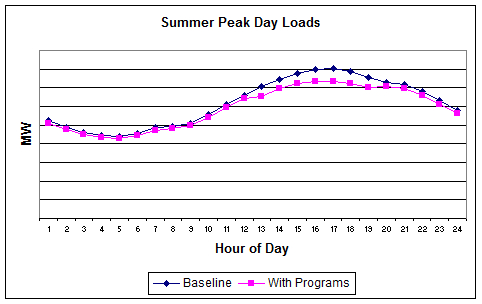
Intuitive Financial AnalysisThe Smart Grid Investment Model provided intuitive financial analysis results documented in a final report and presentation. The model used an Excel workbook platform composed of tabbed worksheets including utility data, customer data, smart grid options, AMI benefits and costs, distribution automation benefits and costs and customer program benefits and costs. All SGIM models were maintained by the SGRC.Standard cost benefit financial statistics including net present value, internal rate of return, quarterly costs and benefits and other data are provided along with intuitive chart presentations including discounted net benefits (cumulative benefits minus cumulative costs at each quarter in the future), cumulative benefits and cumulative costs as illustrated in the charts below. 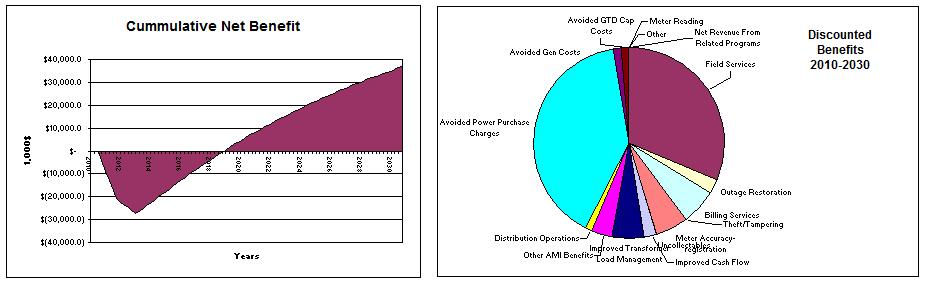
|

|
Click Here to see advantages of MAISY/SGRC data/analysis compared to Department of Energy, NREL and other engineering model-based sources. |