White Paper:
SCE Electric Vehicle (EV) Virtual Power Plant Analysis Shows $5,600 10-Year Savings Per EV Customer
Analysis of 5,000 Southern California Edison customer hourly loads and commuting behavior suggests that residential peak period loads can be completely offset with an EV market share of only 10 %
October 16, 2019 Jerry Jackson, President, Jackson Associates
Click Here to Download the 4-page PDF White Paper
Summary:
Industry experts agree that recent technology cost reductions will significantly increase the percentage of electric vehicles (EVs) in the coming decade. Deloitte forecasts a tipping point in 2022 where the cost of ownership of an EV will reach parity with the cost of an internal combustion engine vehicle. LMC Automotive, a consulting firm that provides market forecasts estimates that EVs will make up 30 percent of the new car market sales by 2030.
Clearly a significant technological transformation is taking place. Utility pilot programs show that potential recharging kW spikes at the end of daily commutes can be distributed with managed charging to shift recharging demands across nighttime hours.
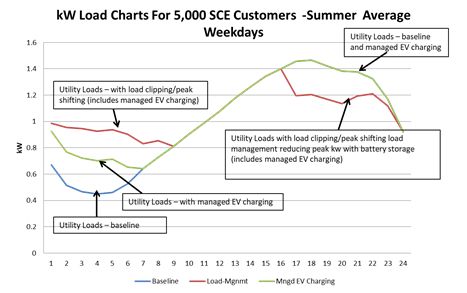
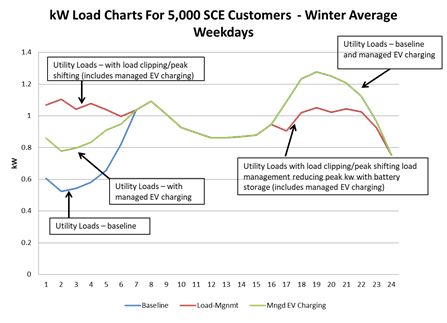
This study analyzed data on 5,000 individual SCE utility customers commuting data and battery reserves after afternoon commuting to simulate the ability of a VPP to clip the residential sector peak while constraining EV overnight recharging to avoid an overnight peak.
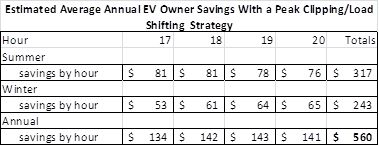
Study results show that, at a market share of just 10 %, combining EV battery electricity supply to the grid in peak period hours along with managed overnight charging can provide an EV virtual power plant (VPP) that completely shaves residential peak demands. Savings are estimated at $560 per EV customer, even after accounting for the cost of recharging the EV battery.
Expected rapid growth of the EV market along with the significant benefits shown here of even limited EV market saturation highlight the urgency of developing appropriate utility programs, EV technologies and regulations to take advantage of this new VPP resource.
Chart and graphs in the white paper


