MAISY Residential Socio-Economic, Building, Commuting, Energy Use and Hourly Loads ZIP-Detailed Databases
|
Database Items In Each of 7+ Million Actual Household Records:
MAISY Database Development DetailMAISY Databases use actual individual household socio-economic data provided by US Census American Community Survey including dwelling unit size, income, demographics, space heating fuel, energy costs, commuting, etc. as a platform to extend each household's information to include a variety of other important data items. These merged data items include information for individual households in dozens of supporting databases including appliance holdings, appliance energy use, metered hourly loads, travel data, building, geodata, and emissions. The data merging process is an AI non-parametric k-nearest neighbor (KNN) machine-learning analysis with regression and Maximum Likelihood Estiamtion refinements providing superior accuracy and reliability for the combined household database. More than 7 million individual household records are provided in the MAISY Databases.... MAISY Database AI MethodologyDatabase records from supporting databases are identified as belonging to each household's "neighborhood" with a weighted distance metric that reflects several dozens of the household’s characteristics. Variables common to both the household and each household in the supporting databases are used to calculate the "distance" between the ACS and each household in the supporting databases.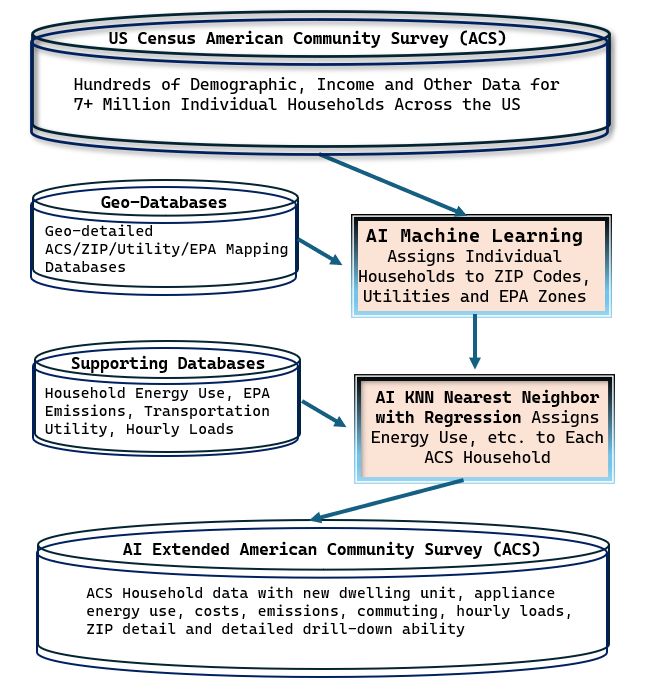
The KNN algorthim is referred to as a machine-learning system because weights on each variable in the distance measure can be determined with repeated evaluations of sample data to identify the most accurate distance measure with respect to the particular merged variable. Data from the supporting database households with the smallest distance measure is merged with the ACS household record. Any difference between the ACS household and the closest neighbor variable values is adjusted with variable-specific statistical regression-based and Maximum Likelihood Estimation data refinements. This AI approach extends ACS individual household records to include dwelling unit physical characteristics, appliance holdings and energy use and costs, GHG emissions, ZIP code location, commuting miles, and end-use/whole building hourly electric kW loads. The non-parametric (read flexible) AI KNN estimation process with statistical refinement is far superior to traditional engineering and other fixed parameter energy use estimating models like those used to develop DOE and NREL energy use and hourly load estimates. The AI KNN application applies actual data derived from similar "neighborhood" households whereas the DOE/NREL approach relies on engineering models that reflect fixed relationships applied to all households, missing nuances that exist in small geographic areas and detailed household/dwelling unit segments - that is data items that are not explicitly reflected in the inflexible DOE/NREL models. The schematic illustrates the MAISY AI KNN process. Individual ACS household records are first geo-located to identify ZIP codes. ACS household record matching is accomplished with the KNN process described above to integrate energy use, appliances, hourly loads, dwelling unit, emissions, commuting data, climate, place, county, metro and utility names, and other information and then provided as a comprehensive household database. MAISY Increases Geographic GranularityIncreased ZIP-level geographic detail make the MAISY Databases far superior at supporting detailed socio-economic, marketing, market sizing and other applications compared to alternative household resources.Data Formats Like You WantDatabase information can be provided in spreadsheets with data for individual household records in separate rows, and/or processed by us to provide tables, cross tabs or any client-specified analysis results.MAISY Database ItemsThe following table shows data item detail available with the MAISY Database. Clients can select any data groups or data items for any geographic area (single ZIP, county, metro, etc.) and data format/analysis preference including full CVS databases with each household data items on a single row, individual relational databases that can be merged (joined), tables, cross-tabs, etc.Electric loads (kW) are available as 8760, 35040 15-minute, or monthly averages (weekday, weekend day and peak day). Load detail includes whole building loads and individual end use loads. Not sure exactly what data items you need, or which data items are best for the project at hand? - Let us help! – just e-mail us with your questions and/or suggest a time to discuss. We provide free consultations to help identify the most useful data/analysis for your application. We also provide free telephone support to assist in client data applications after data delivery.
Additional MAISY Residential Database Background DetailClick here to see a variety of related background information.Save Cost, Time and Hassle and Improve Analysis Accuracy With MAISY DatabasesWhether you want to extend socio-economic evaluations to the ZIP level, expand household information with new data items (e.g. energy bills, emissions, floor space), drill down on specific ZIP household segments or are looking to improve you market analyis and target marketing, MAISY Databases provide new and more accurate analysis results.Some applications:
Database CostsMAISY Databases include proprietary information belonging to Jackson Associates and are licensed to individual users who agree to use the information only within their own organization. Information is provided in any of the following formats: (1) databases with individual household records in CSV files for client-specified database items and ZIP codes, (2) client-specified tables/cross-tabs for any combination of database items and ZIP codes. Database costs depend on data items and ZIP codes included in the data request. We provide free consultations to discuss data needs and will be happy to suggest appropriate data selections for you project.We understand the difficulties in identifying exactly the information you need for your project. Casting a wide net costs more; however, trying to minimize data collection costs can dramatically reduce information value. We have worked with start-ups and some of the largest energy-industry organizations to thread this needle based on our energy data analysis experience. We can help identify options and suggest the most effective data develoment strategies for your projects. – just e-mail us with your questions and/or suggest a time to discuss. We provide free consultations to help identify the most useful data/analysis for your application. We also provide free telephone support to assist in client data applications after data delivery. |
|||||||||