New: Whole Building and End Use Hourly Loads Added to RECs Database
New Forecasting Models Use Extended RECS Residential Energy and Hourly Load Databases to Forecast Smart Gird, Demand Response and Load Management Analysis and Programs
|
The most recent Department of Energy’s Residential
Energy Consumption Database (RECS,final release in June 2023 )
has recently been extended by
Jackson Associates to include whole-building and end-use 8,760 hourly
kW loads and emissions for each of the 18,400+ households in its national survey.
This note presents average state-level variations in whole building hourly kW load profiles along with an example that highlights the benefits of examining individual household load profiles in more detail. A comparative analysis of a single state’s average water heating hourly load profile and hourly loads for individual households illustrates the advantages of focusing on individual household characteristics to target the most appropriate households for smart gird, demand response and load control program development and analysis. See more detail on the MAISY RECS Hourly Load Databases 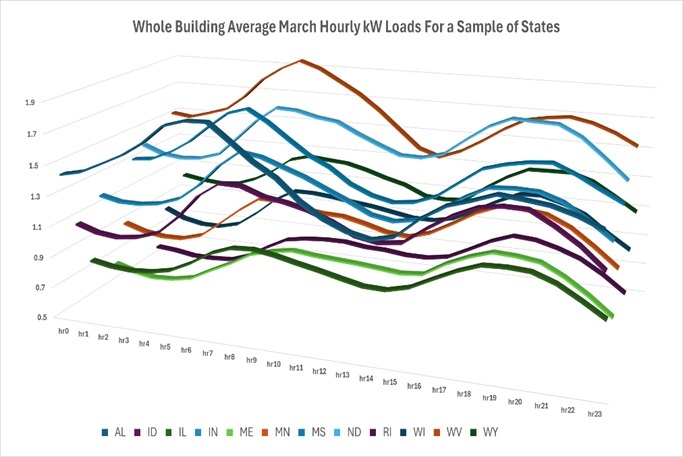 The Department of Energy’s 2020 Residential Energy Consumption Database (RECS, final release,
June 2023) has recently been extended by Jackson Associates to include whole-building and seven
end-use 8,760 hourly kW loads and emissions data for each of the 18,400+
households in the national survey.
The Department of Energy’s 2020 Residential Energy Consumption Database (RECS, final release,
June 2023) has recently been extended by Jackson Associates to include whole-building and seven
end-use 8,760 hourly kW loads and emissions data for each of the 18,400+
households in the national survey.
State Hourly Loads The extended survey includes state identifiers for each household providing state-level comparisons of energy use, hourly loads and household characteristics. Significant diversity exists in state-average residential kW loads profiles reflecting variations in household income, demographics, appliance holdings, climate, and other factors. The following chart of state average March whole building residential loads illustrates this diversity. Average household kW demand varies by more than a factor of two across states while evening peaks are greater than morning peaks in about half the states. End-Use Loads 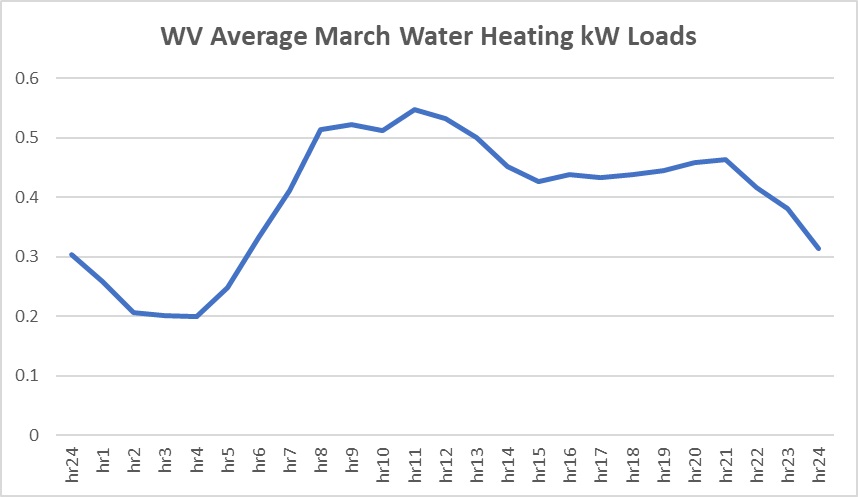 The previous chart shows relatively smooth load profiles for monthly average whole
building residential loads. Monthly average end-use hourly loads also reflect relatively
smooth load profiles as indicated by March average water heating load profiles for West
Virginia households in the chart below. This chart suggests that an early morning potential
demand response program has the potential to reduce demand by only about 0.1 kW (0.55 – 0.45 kW)
per household, a relatively small gain for a potentially expensive system-wide program.
The previous chart shows relatively smooth load profiles for monthly average whole
building residential loads. Monthly average end-use hourly loads also reflect relatively
smooth load profiles as indicated by March average water heating load profiles for West
Virginia households in the chart below. This chart suggests that an early morning potential
demand response program has the potential to reduce demand by only about 0.1 kW (0.55 – 0.45 kW)
per household, a relatively small gain for a potentially expensive system-wide program.
However, drilling down to individual household water heating load profiles in the extended WV databaseshows a considerably larger potential impact for a program targeting households with early morning water heating loads greater than 1 kW. Identifying a smaller target population with larger program potential savings can turn a cost-ineffective program into a program that saves money for both the utility and utility customers. 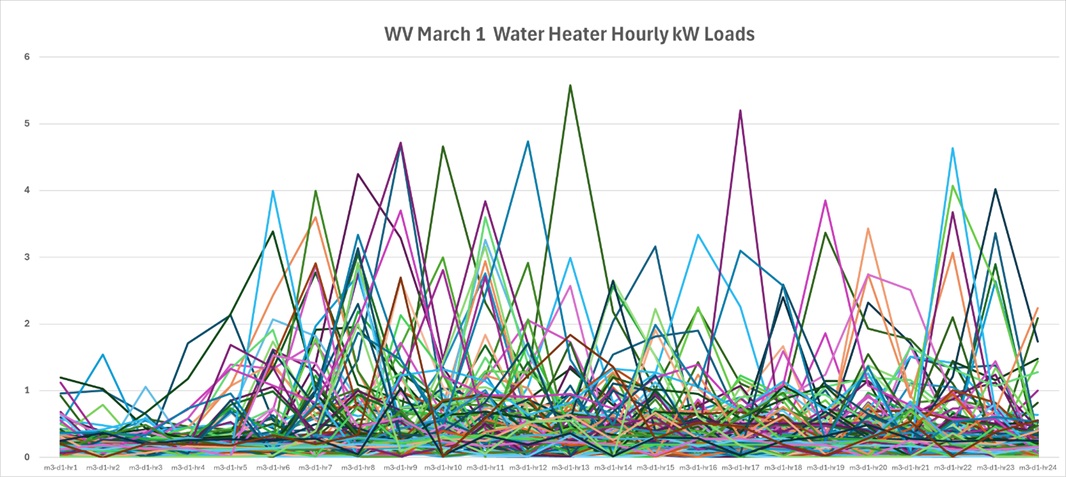 Extended MAISY RECS Hourly Load databases include demographic, income, and other
characteristics for each household providing an opportunity to identify customer
characteristics correlated with larger than average peak morning water heating use.
These customer characteristics can then be used to target high-value potential
water heating program participants and to better inform utility planning and smart
grid/demand response initiatives.
Extended MAISY RECS Hourly Load databases include demographic, income, and other
characteristics for each household providing an opportunity to identify customer
characteristics correlated with larger than average peak morning water heating use.
These customer characteristics can then be used to target high-value potential
water heating program participants and to better inform utility planning and smart
grid/demand response initiatives.
Hourly load data extensions for each RECS household are provided by Jackson Associates using a nearest neighbor machine learning process that matches RECS household characteristics with characteristics from a MAISY Database of ACTUAL metered hourly loads. Heating and air conditioning energy use and hourly loads for each record are adjusted to reflect typical meteorological year weather data using DOE EPLUS engineering analysis. A sample MAISY RECS Hourly Load Database provides additional insight on these extended database capabilities. About the Author. Jerry Jackson is a Ph.D economist, president of Jackson Associates (JA), and publisher of the MAISY Residential and Commercial Energy Use and Hourly Loads Databases and MAISY Scope 3 Emissions Databases. JA also provides consulting services to support database applications. JA clients include more than 150 private companies, utilities, state and federal agencies. |
Related MAISY Topics |