| Agent-Based Extended RECS Energy and Hourly Load Forecasting Models |
Apply Extended RECS Hourly Loads Databases to Develop Excel Agent-Based Energy and Hourly Load Forecasting Models
|
Energy and hourly load forecasting typically requires statistical knowledge applied in econometric models or in-depth appliance engineering data and market information used in end-use models. Agent based models apply an intuitive framework that models individual households, i.e., agent, behavior. This approach requires neither a statistical background nor detailed appliance engineering knowledge to produce model forecasts that, in many ways, are preferable to traditional econometric and end-use models.
This paper describes the development and application of an easy-to-use agent-based Excel model that applies an extended version of The Department of Energy’s 2020 Residential Energy Consumption Database (RECS, final release, June 2023). The RECS Database has been extended by Jackson Associates to include whole-building and end-use 8,760 hourly kW loads for each of the 18,400+ households in its national survey. Agent based models have been used in a variety of industry applications for decades to provide valuable insights not available with econometric and end use models. RECS Extended Hourly Loads Databases provide a relatively simple agent-based easy-to-use Excel framework to forecast future energy demands and hourly loads. Model forecasts reflect impacts of electric price, income and equipment efficiency increases along with various demand management initiatives and other factors on individual households. Example Forecast Summary ResultsThe Excel forecasting model described in this paper was applied to forecast energy and hourly loads for single family homes in Texas using extended EIA RECS database.2030 Texas Model forecasts results shown below assume 2020 – 2030 changes based primarily on trends observed from 2010 to 2020 and recent updates of minimum efficiency requirements:
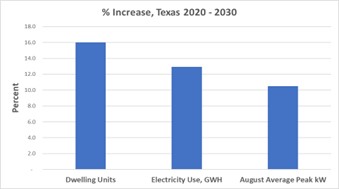
Forecast results show an improvement both in electricity use per dwelling unit and summer peak kW. Dwelling units increased by 16 percent; however, average dwelling unit electricity use increased by 12.9 percent while average August peak increased by only 10.5 percent. 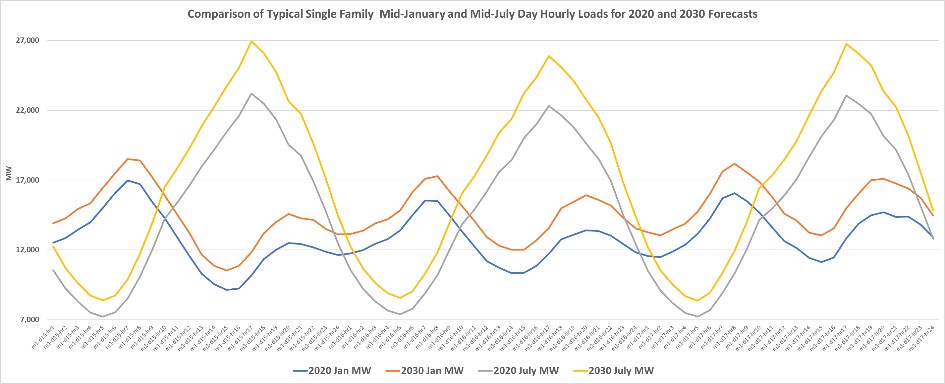
A comparison of the 2020 and 2030 model forecast hourly loads for mid-January and mid-July model forecast shows dampened peak profiles reflecting the increases in AC and space heating equipment expected to occur by 2030. RECS Extended Energy and Hourly Load Agent-Based ModelingWhile the model behind these forecasts is an easy-to-use Excel model requiring no special statistical or software modeling skills, the model itself is an application of an advanced modeling technique known as agent-based modeling. Agent-based modeling has been applied in the past in energy forecasting and dozens of other disciplines for decades. The availability of the MAISY RECS Hourly Load Databases provides a new, easier entre to this powerful modeling technique.An agent-based model framework includes data on individual agents – in this case single family households. Impacts of exogenous influences such as energy prices, income, and efficiency standards are applied to individual households providing the ability to differentiate among the different households. For example, dwelling unit demolitions are more frequent for older dwelling units and AC units in new construction and replacements must adhere to new minimum efficiency standards The beauty of this modeling approach is that almost any “what-if” assumption can be assessed without changing the model structure or investing in complicated software modifications. The remainder of this paper provides more detail on this Excel agent-based model and its application. Texas ExampleThe extended Texas RECS Database includes data for 972 single family households. The following variables values for each household record are used in the Excel model to forecast future energy use and hourly loads:
Building Vintage ImpactsBuilding practices, building codes and construction standards have changed significantly over time (17 % of TX single-family dwelling units were built before 1960). Older dwelling units tend to be smaller and less expensive, so occupant characteristics also contribute to energy use and hourly load variations across building vintages.Identifying building vintage-related energy use characteristics is critical in the forecasting process because some older dwelling units will be removed over time and new dwelling units are required as population increases. 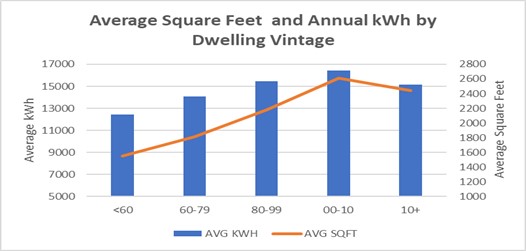
The chart on the left shows that the newest dwelling unit vintage category has an average of 58 percent more square feet but uses only an average 22 percent more electricity compared to the oldest vintage category. 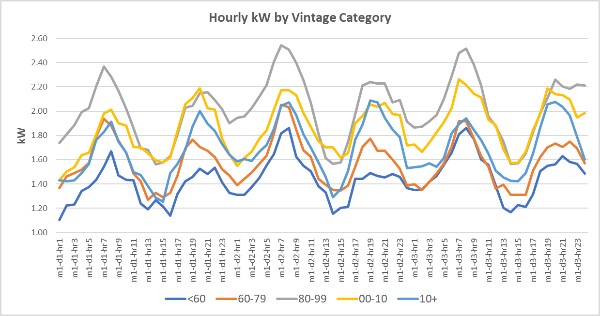
Average hourly load profiles also vary by dwelling vintage. The following chart illustrates this variation over the first three days of January for five vintage categories. The 1980-1990 peak kW on hour 7 day 2 is 37 percent greater than the <1955 category (2.54 versus 1.86 kW). Next greatest peak on this day is for the 2000-2010 vintage (2.17 kW) with 1960-79 and 2010+ in the middle at 2.07 kW. These relative values of vintage profiles are reasonably consistent over the three days shown. Summing the 8760 kW for each dwelling unit provides the average annual kWh used in each vintage category shown in the previous chart. 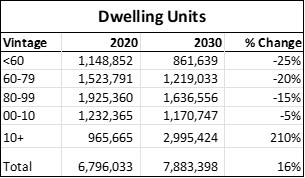
Total kW loads are calculated by multiplying hourly load profiles of each vintage category by the number of dwelling units in each category and summing. The number of dwelling units in each vintage category changes from 2020 to 2030 to reflect demolitions in older vintage categories and an increase in the newest category. We have assumed a typical demolition rate of 1 percent per year for the 2020 building stock with older vintages being demolished at a greater rate as shown in the table. We also assumed that the increase in dwelling units from 2020 to 2030 would provide a match for the 16 percent population increase from 2010 to 2020. The first step in the forecast process is to multiply 2030 dwellings in each vintage category times the number of estimated 2030 dwellings. The resulting hourly loads and annual kWh for each vintage category reflect a “business as usual” scenario that reflects only a change in the relative importance of vintages. However, three potentially important influences from 2020 to 2030 must also be considered:
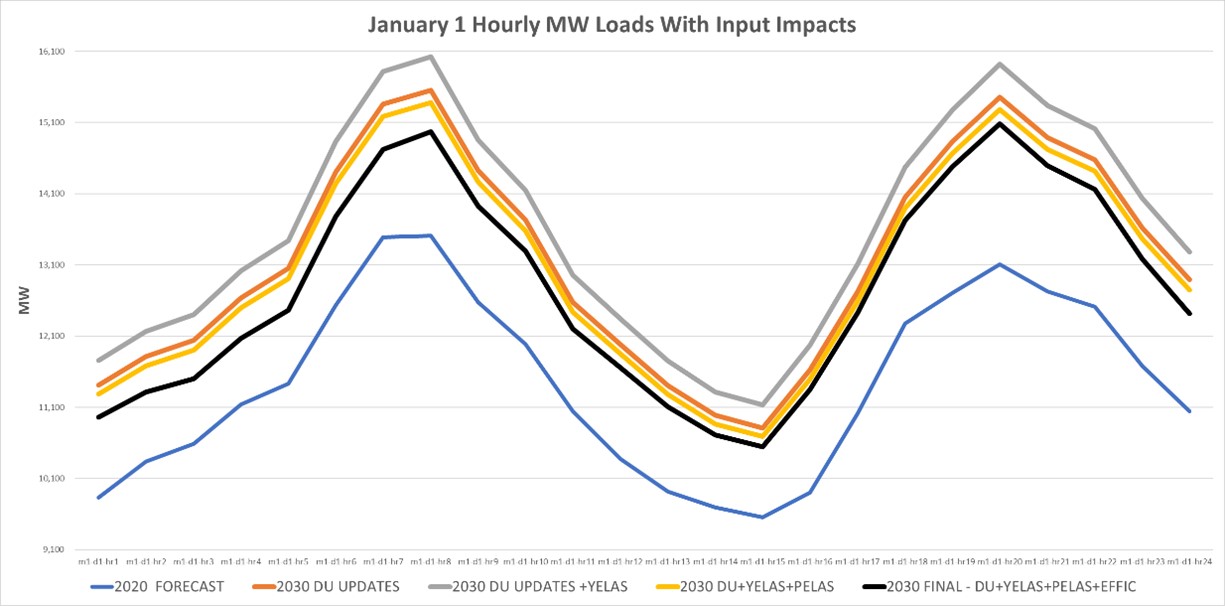
Price, Income and Efficiency Impact ModelingPrice Impacts The impact of electricity price increases is modeled with short-run price elasticity; that is a percentage change in energy use resulting from a percentage change in electricity price. Long run price elasticities reflect behavioral changes such as fuel switching that are captured elsewhere in this model structure. This model application assumes that real (adjusted for inflation) electric prices will increase by 10 percent from 2020 to 2030. Recent electricity prices trends suggest an approximately 10 percent real price increase over the decade. The model’s price elasticity of -0.2 results in a decrease in energy use of 2 percent over the forecast decade.Income Impacts Increases in inflation-adjusted income result in increased electricity use as households expand their ownership of electric appliances (e.g. computers, etc.) and relax their concerns over electricity costs. Texas real median income increased by about 15 percent over the past decade; the forecast assumes the same increase in 2020 to 2030. The increase in the number of households in the 2010+ vintage category and reduction in households in older vintages reflects an increase in the average income of 8 percent. An additional 7 percent income impact is included in the forecast which, with a short-run income elasticity estimate of 0.5, increases energy use by 3.5 percent by 2030. The net contribution of both price and income increases is a 1.5 percent increase in energy use from 2020 to 2030. Efficiency Impacts New and replacement AC and heat pump efficiencies are greater on average than existing equipment, a trend that is accelerated with new minimum efficiency standards required in January 2023. Average AC and heat pump efficiencies are conservatively assumed to increase by 10 and 5 percent respectively. Unlike price and income impacts, these efficiency improvements impact only heating and AC energy use and hourly loads. The internet literature on short-run price and income elasticities and AC /heating efficiency improvements is extensive so even the most casual user of the Excel model can quickly become familiar with likely bounds for these three scenario parameters. Each of these inputs can easily be changed to evaluate alternative scenarios providing a robust “what-if” analysis of different input assumptions that all operate of the “evidence-based” extended RECS framework. The following charts show the impacts of dwelling unit vintage updates (DU UPDATES), income and price elasticities (YELAS and PELAS) and efficiency increases (EFFIC) on annual GWH electricity use and January 1 hourly loads. 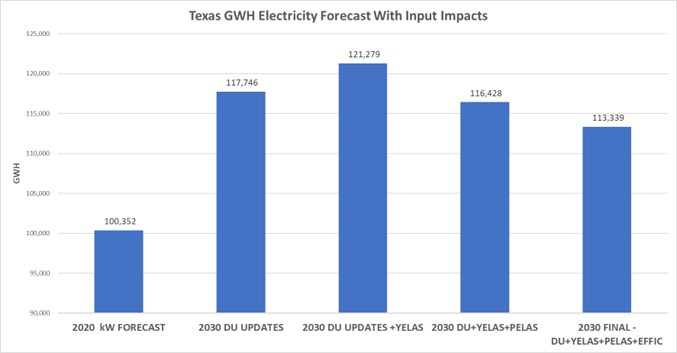
Steps in the Excel Model ForecastThe MAISY RECS framework was applied in the Excel Model with the following steps to generate a 2030 energy use and 8760 hourly loads forecast:
A Final Note on Extended RECS Agent-Based Excel ModelsThe beauty of a MAISY RECS-based Excel model is that its application requires only a limited ability to apply Excel equations. It does not require a statistical background or programming skills. Its application requires common sense and a brief familiarity with some supporting information (e.g., reasonable ranges of short run price elasticities).This example compares 2020 and 2030 energy and hourly loads; however, the model can also be applied for each year in the forecast period. Extended RECS Hourly Loads Databases and Agent-based Excel RECS Energy Use and Hourly Loads Forecasting Models are available for any state from the author. About Jackson AssociatesJackson Associates (JA) publishes MAISY Residential and Commercial Energy Use and Hourly Loads Databases, MAISY RECS Databases and MAISY Scope 3 Emissions Databases. JA also provides energy and hourly load forecasting models for electric utilities, state and federal government agencies and other energy-related technology companies. |
Related MAISY Topics |