Top-Down EV Forecasts vs Customer Digital Twins

The same number of EVs can create very different local grid impacts.

System forecasts answer how much EV adoption may occur. Customer digital twins add the household, geographic and hourly detail needed to estimate where adoption clusters, when charging coincides with existing load and which locations merit engineering attention.

Fair method comparison · Hybrid GIM forecasting · Localized 8,760 load results
The honest comparison

Both approaches are useful—but for different planning questions

Top-down methods are not inherently wrong. The problem comes when a broad forecast is pushed into a small-area distribution decision without enough customer, geographic or hourly detail.

Top-down forecasts establish direction and scale

State, regional and utility scenarios are efficient for forecasting total vehicle adoption, annual energy, broad system load growth and alternative policy futures. They provide a necessary service-area planning context.

Customer digital twins locate and time the impact

Household characteristics and customer-level hourly loads help allocate the scenario realistically across neighborhoods and show how charging combines with existing residential demand.

Method-by-method comparison

What changes when forecasting starts with customers

The difference is not simply more rows of data. It is the ability to preserve adoption drivers and charging behavior before results are aggregated.

Planning dimension
Top-down allocation
Customer digital twins
Starting point
Regional or service-area EV total
Actual households and individual EV probabilities
Service-area EV total
Forecast directly
Scenario target applied through household probabilities
Geographic allocation
Customer counts, load shares or broad segments
Household and neighborhood characteristics
Adoption clustering
Added through assumptions or external allocation
Emerges from differences among customers
Charging loads
Average load shape applied to groups
Customer charging added to existing whole-home loads
Time resolution
Annual, seasonal or selected peak hours
8,760 hourly results by customer and geography
Customer filtering
Limited after aggregation
Income, education, dwelling, construction year and other filters
Managed charging
Average program impact assumption
Participation, availability, control and hourly shifting scenarios
Best fit
Policy, energy and broad system planning
Localized screening, program targeting and engineering-load development
The GIM hybrid approach

Use top-down scenarios for the total—and bottom-up probabilities for the allocation

GIM does not discard the utility-wide forecast. It uses that scenario as a control total, then determines where ownership and hourly load are most likely to appear.

01

Set the scenario

Select current, 2030 or 2035 EV ownership growth for the service area.

02

Estimate probabilities

Apply AI-assisted nearest-neighbor analysis to actual identity-protected households.

03

Allocate new owners

Meet the scenario total while preserving differences in customer propensity.

04

Build hourly loads

Add charging profiles to customer baseline and end-use 8,760 loads.

05

Aggregate and screen

Produce block-group, ZIP, selected-area and service-area planning results.

Why this is more defensible: The utility can revise the overall adoption scenario without assuming that every neighborhood grows at the same rate. Total EV ownership remains controlled, while its geographic and hourly consequences reflect the customer population.
Why adoption clusters

Customers and neighborhoods do not adopt new technology uniformly

GIM uses consistent identity-protected characteristics to differentiate representative households before future EV ownership is assigned.

$

Income and education

Economic resources and educational attainment are associated with differing probabilities of early EV adoption.

HOME

Housing and tenure

Single-family housing, homeownership, dwelling characteristics and access to charging influence adoption and load impacts.

TRIP

Commuting

Distance, departure and return patterns help determine vehicle use, required charging energy and charging time.

AGE

Household demographics

Householder age, household composition and vehicle holdings contribute to differences among representative customers.

LOAD

Existing hourly load

The same charger kW creates different transformer exposure when combined with different baseline home loads and peak timing.

GEO

Geographic concentration

Similar households often live near one another, allowing customer-level differences to become neighborhood-level clusters.

The planning consequence

A broad forecast can meet its system target and still miss tomorrow’s hot spots

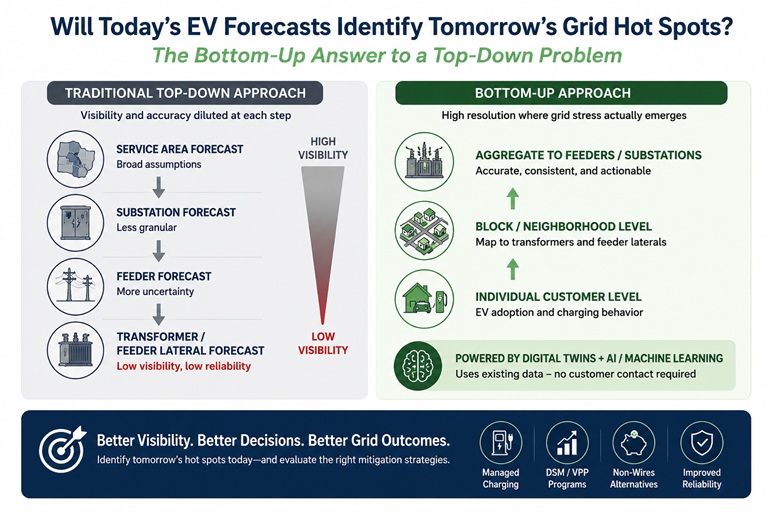
When the same EV growth is distributed proportionally, every area receives a manageable-looking share. When ownership is allocated through customer propensities, a small number of neighborhoods can emerge with much higher adoption and coincident charging.

That local concentration is what drives transformer screening, feeder studies, targeted managed-charging recruitment and the timing of distribution investment.

Will today's EV forecasts identify tomorrow's grid hot spots comparison of top-down and bottom-up EV forecastingOpen the original comparison graphic full size ↗
Questions that require localized detail

Move beyond “How many EVs?”

Customer digital twins become valuable when the decision depends on who, where and when—not merely the service-area total.

01

Which block groups adopt first?

Compare customer propensity, forecast ownership, charging load and hours above selected thresholds.

02

When does charging coincide with peak?

Combine charging with customer baseline loads across all 8,760 hours rather than one assumed peak value.

03

Which areas warrant transformer review?

Use localized forecasts with utility-selected transformer size, current loading and planning limits.

04

Where should managed charging be targeted?

Focus acquisition and incentives in customer segments and locations where peak reduction produces greater value.

05

What happens under extreme weather?

Evaluate charging alongside AC or space-heating peaks rather than treating EV load in isolation.

06

What data should enter engineering tools?

Export priority-area hourly profiles for CYME, Synergi, WindMil, OpenDSS or other utility workflows.

Responsible comparison

Customer detail improves the forecast—but does not eliminate uncertainty

A bottom-up model can be more useful for distribution planning without being a prediction of exactly which household will buy an EV.

What digital twins improve

  • Geographic differentiation within the service area
  • Customer segmentation and adoption clustering
  • Interaction of charging with existing whole-home loads
  • Hourly and seasonal peak coincidence
  • Targeting of engineering and program analysis

What remains uncertain

  • The utility-wide pace of future EV adoption
  • Future vehicle, charger and charging behavior
  • Individual household purchase decisions
  • Program enrollment and control performance
  • Asset-specific conditions without utility mapping and measurements
Choose the detail appropriate to the decision

Not every forecast needs customer digital twins

The extra detail is justified when it changes the decision. Otherwise, a simpler forecast may be entirely adequate.

TOP-DOWN MAY BE ENOUGH

Broad energy and policy planning

Use when the primary need is total EV count, annual kWh, broad system capacity or statewide scenario comparison.

DIGITAL TWINS ADD VALUE

Localized distribution planning

Use when neighborhood clustering, hourly peaks, transformer exposure or customer targeting affects the answer.

BEST GIM PRACTICE

Combine both levels

Use a transparent service-area scenario to set the total and customer digital twins to allocate and translate it into hourly grid loads.

Frequently asked questions

Top-down forecasts and customer digital twins

Is a top-down EV forecast inaccurate?

Not necessarily. It may be entirely suitable for forecasting total adoption, energy and broad system impacts. Its limitations become important when that aggregate result is used for small-area distribution decisions.

Does GIM ignore utility-wide EV forecasts?

No. The selected service-area EV scenario controls the total. Household probabilities determine how that growth is allocated across representative customers and geographic areas.

Why can two forecasts with the same EV total produce different peak loads?

Charging timing, existing household load and geographic concentration affect coincidence. Equal annual energy or vehicle totals do not guarantee equal local or peak-hour kW.

Do customer digital twins identify actual future EV buyers?

No. They estimate probabilities for identity-protected households. The goal is more realistic aggregate customer and geographic patterns—not individual prediction.

Can GIM produce feeder or transformer results?

GIM produces customer and small-area hourly forecasts. Feeder or transformer analysis requires appropriate utility mapping, asset assumptions or exports to engineering models.

How does this support managed charging?

Localized forecasts help estimate coincident charging load and identify customer segments or areas where enrollment may create greater G&T or distribution value.

See what the system average may be hiding.

Request a guided comparison of utility-wide scenarios, customer probabilities, localized EV clusters and 8,760 grid impacts.

Request a Demonstration